Tracking Movements on the RTTEP
This topic describes how to view details about movements, origins, and destinations on the Real-Time Transportation Execution (RTTEP) page.
Complete the following steps to track movement details on the RTTEP:
Log in to the ONE application as a Transportation Manager role.
Click Menus/Favs > Transportation > Real-time Transportation Execution.
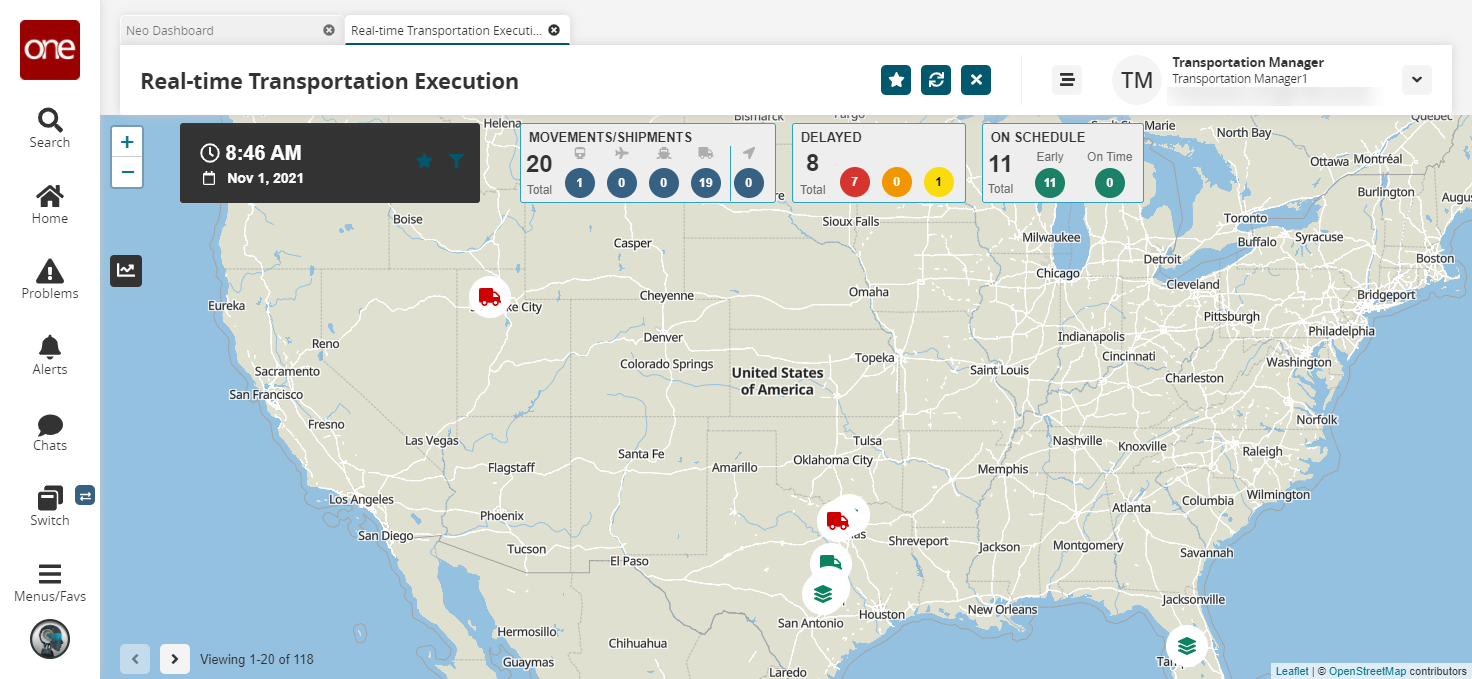
The Real-time Transportation Execution page appears with mode-wise movement statistics, delay statistics, and on-schedule shipments statistics.
In the NEO UI, users can click on the Menu/Favs icon on the left sidebar and type in the name of the screen in the menu search bar. For more information, see "Using the Menu Search Bar."
Click the favorite icon to view previously favorited movements and shipments.
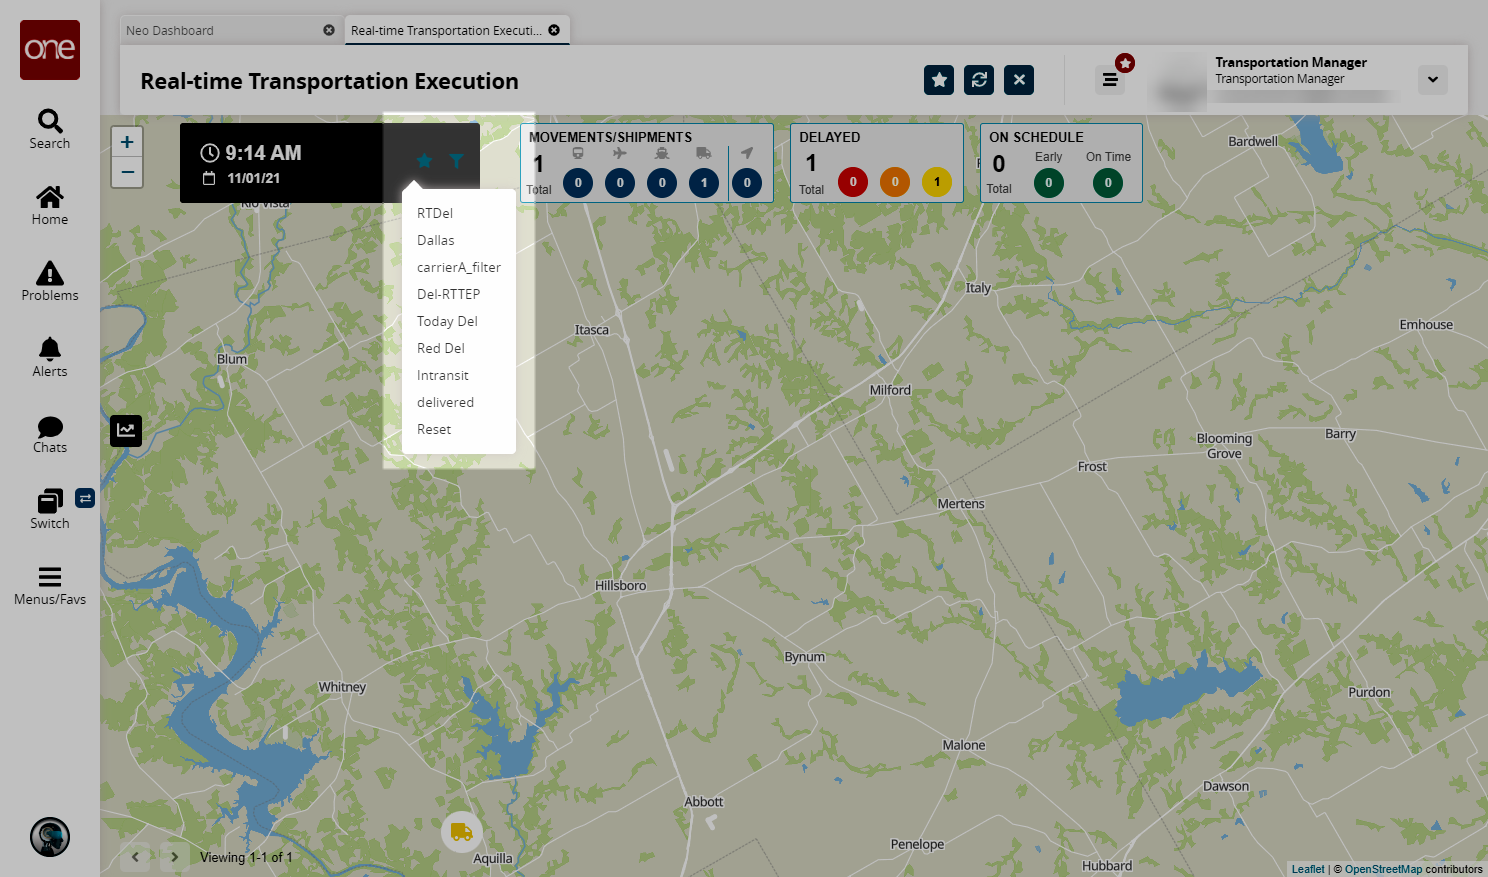
The visible movements update accordingly.
Click the filter icon in the time and date widget to determine what type of movements/shipments are shown on the map.
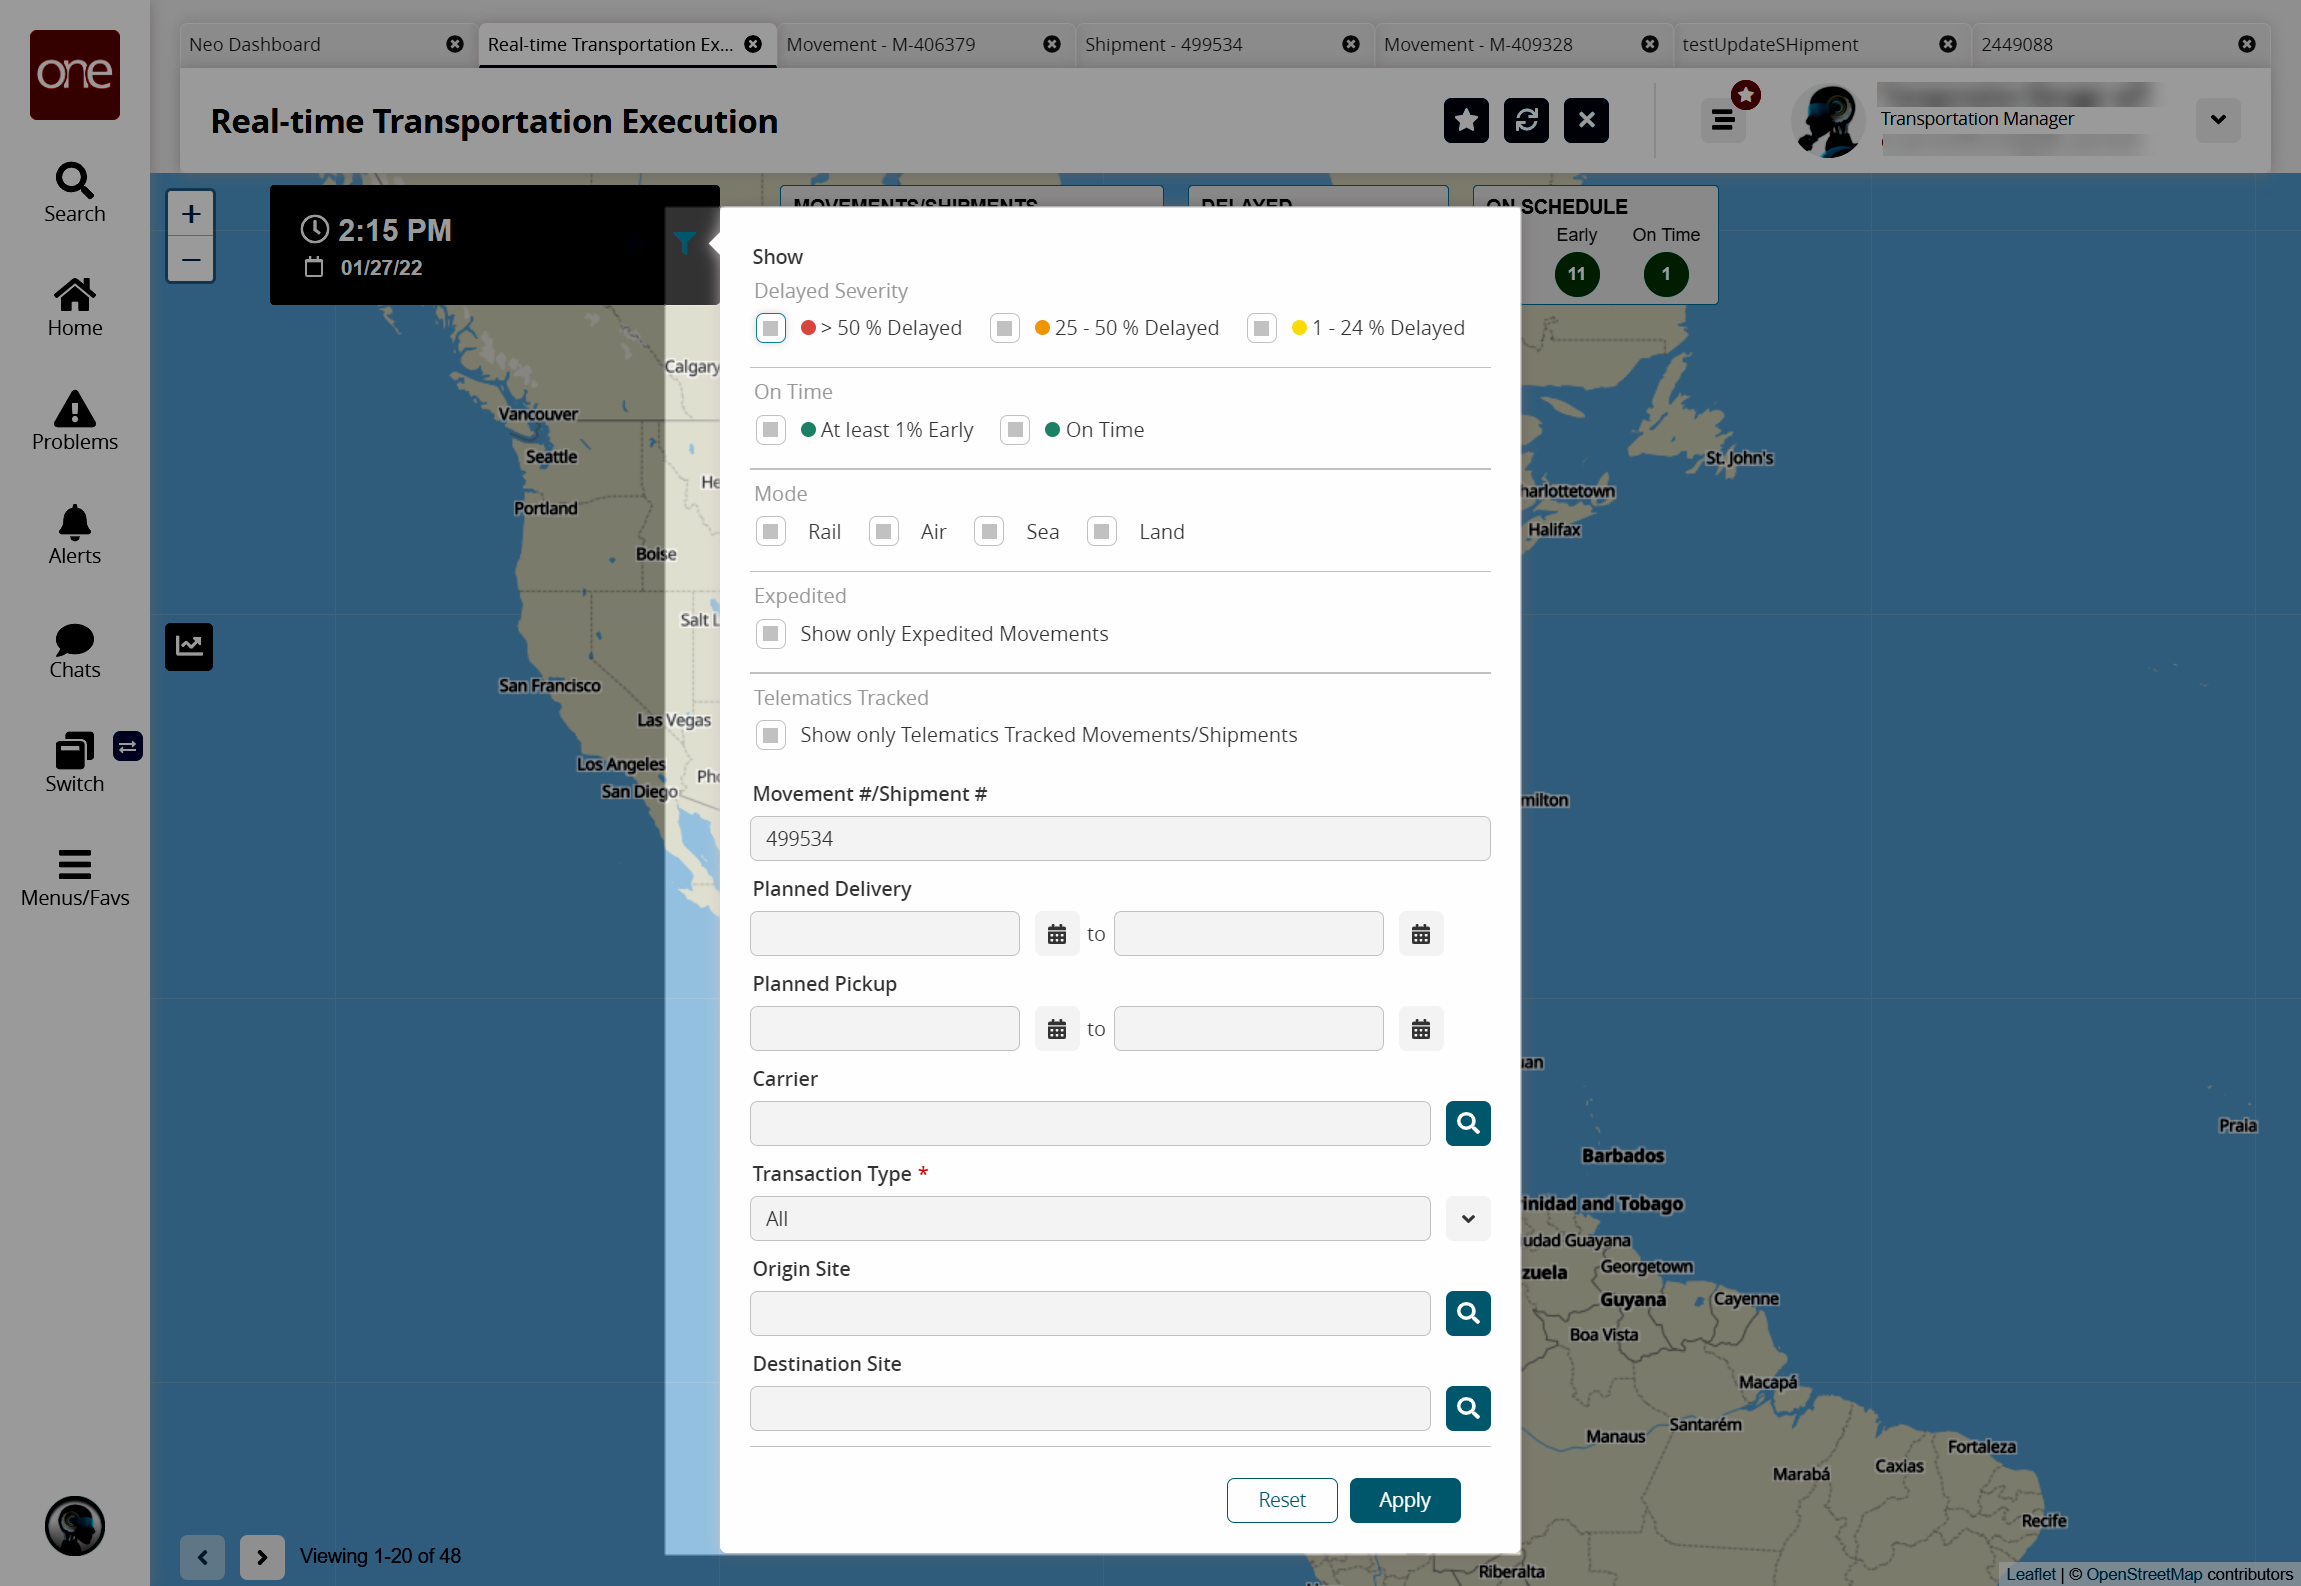
Enter values for fields described in the table below. Fields with an asterisk ( * ) are required.
Field
Description
Delayed Severity
Sele ct any combination of checkboxes for levels of all delay severity. The available options are > 50 % Delayed, 25 - 50 % Delayed, and 1 - 24 % Delayed.
Movement #/Shipment #
Enter a movement or shipment number.
On Time
Select any combination of checkboxes for on-time status. The available options are At least 1% Early and On Time.
Mode
Select any combination of checkboxes for transportation modes. The available options are Rail, Air, Sea, and Land.
Expedited
Select the Show only Expedited Movements checkbox to only show expedited movements.
Telematics Tracked
Select the Show only Telematics Tracked Movements/Shipments checkbox to only show movements and shipments that are tracked by telemetry.
Planned Delivery
Enter a planned delivery date range.
Planned Pickup
Enter a planned pickup date range.
Carrier
Select a carrier from using the selector tool.
* Transaction Type
Select the transaction type from the dropdown list.
Origin Site
Select an origin site using the selector tool.
Destination Site
Select a destination site using the selector tool.
Click the Apply button.
The RTTEP updates and displays the shipments and movements that match the selected criteria.
The Movements widget shows (from left to right):
The total number of movements visible on the current map configuration. In this example, 11. This value is a summation of the rail, air, sea, and land movements
The number of movements transported by rail.
The number of movements transported by air.
The number of movements transported by sea.
The number of movements transported by full truckload (TL), less than a truckload (LTL), or parcel.
The number of movements being tracked in real-time by the ONE mobile application. This value is independent of the number of rail, air, sea, or land movements, but cannot be more than the total number of movements shown.
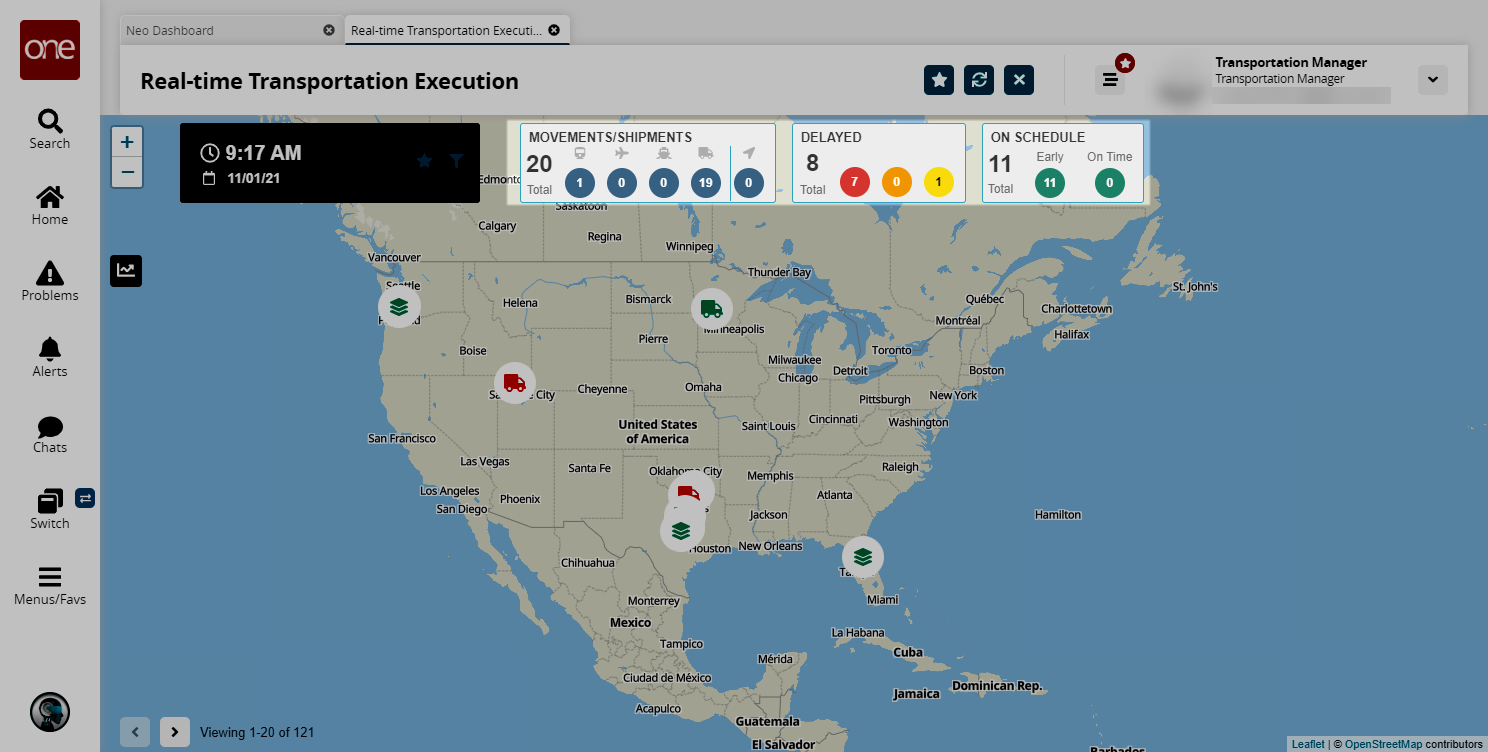
The Delayed and On Schedule widgets show the number of movements that are delayed, the severity of the delay, and the number of movements on schedule.
Click a Vehicle icon
 to access an individual movement or click the Stack icon
  to see a list of all movements on the route.
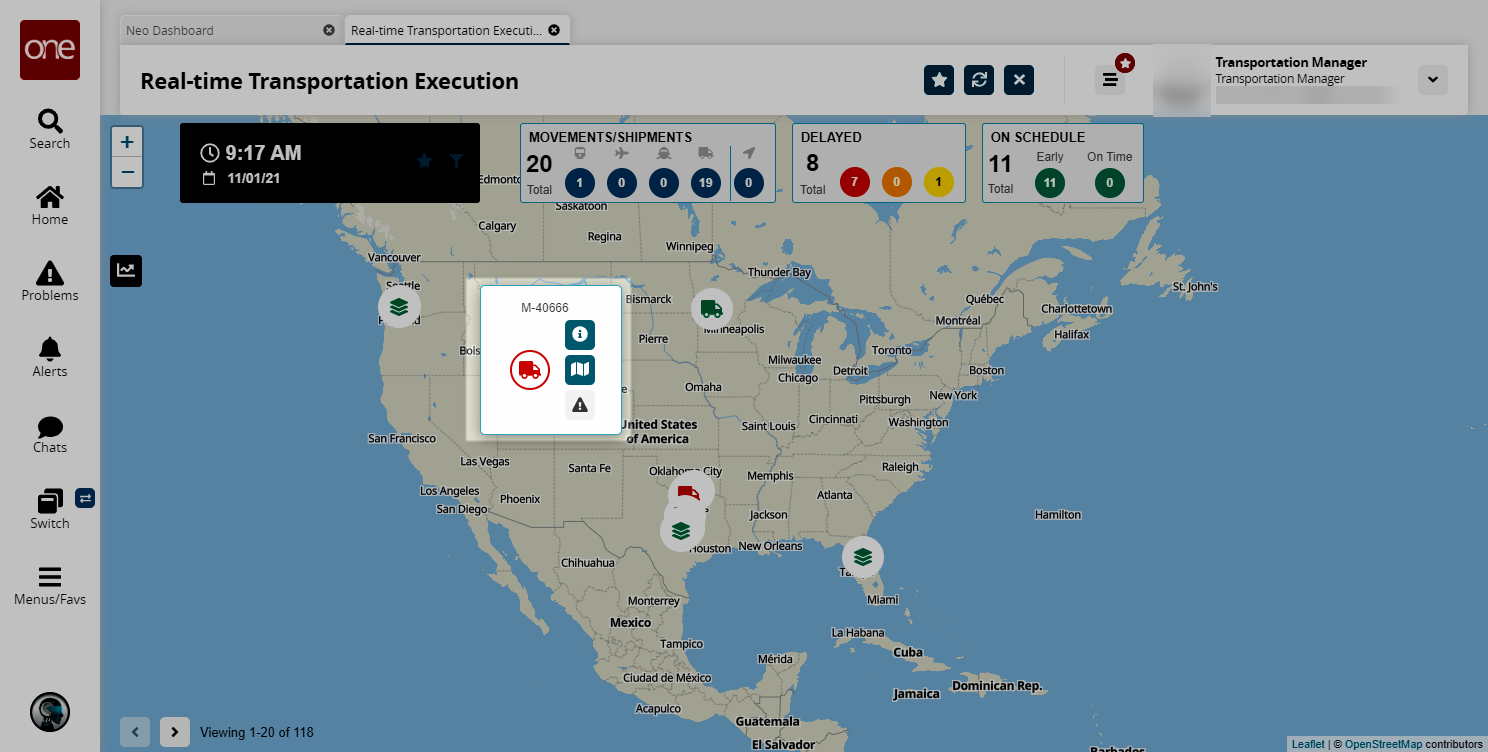
Click the Information icon
 to view details like Asset ID, Driver Details, Location Details, and Movement Details in a card view.
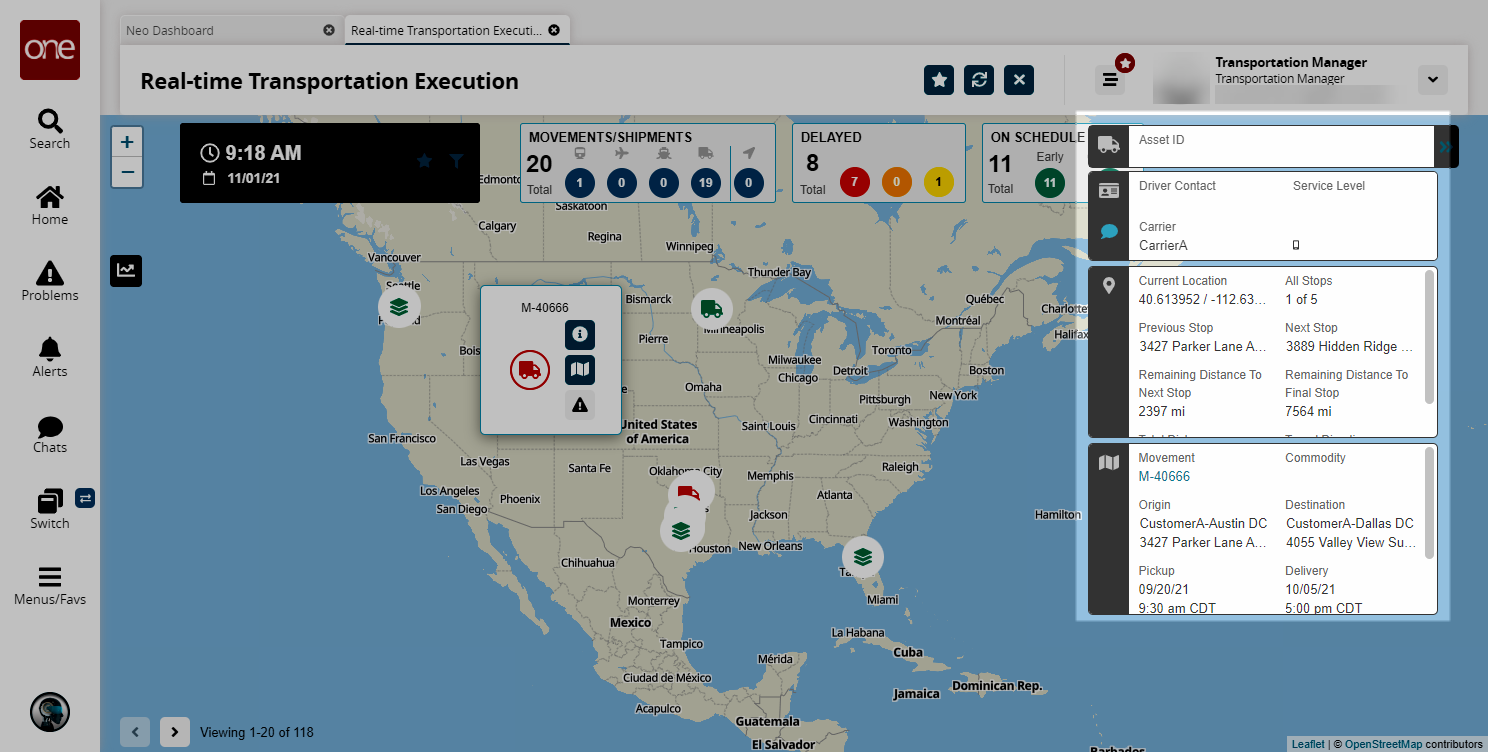
Click the Map icon
 to view details related to the origin and destination like Movement State, Pickup Status, and Delays (if any).
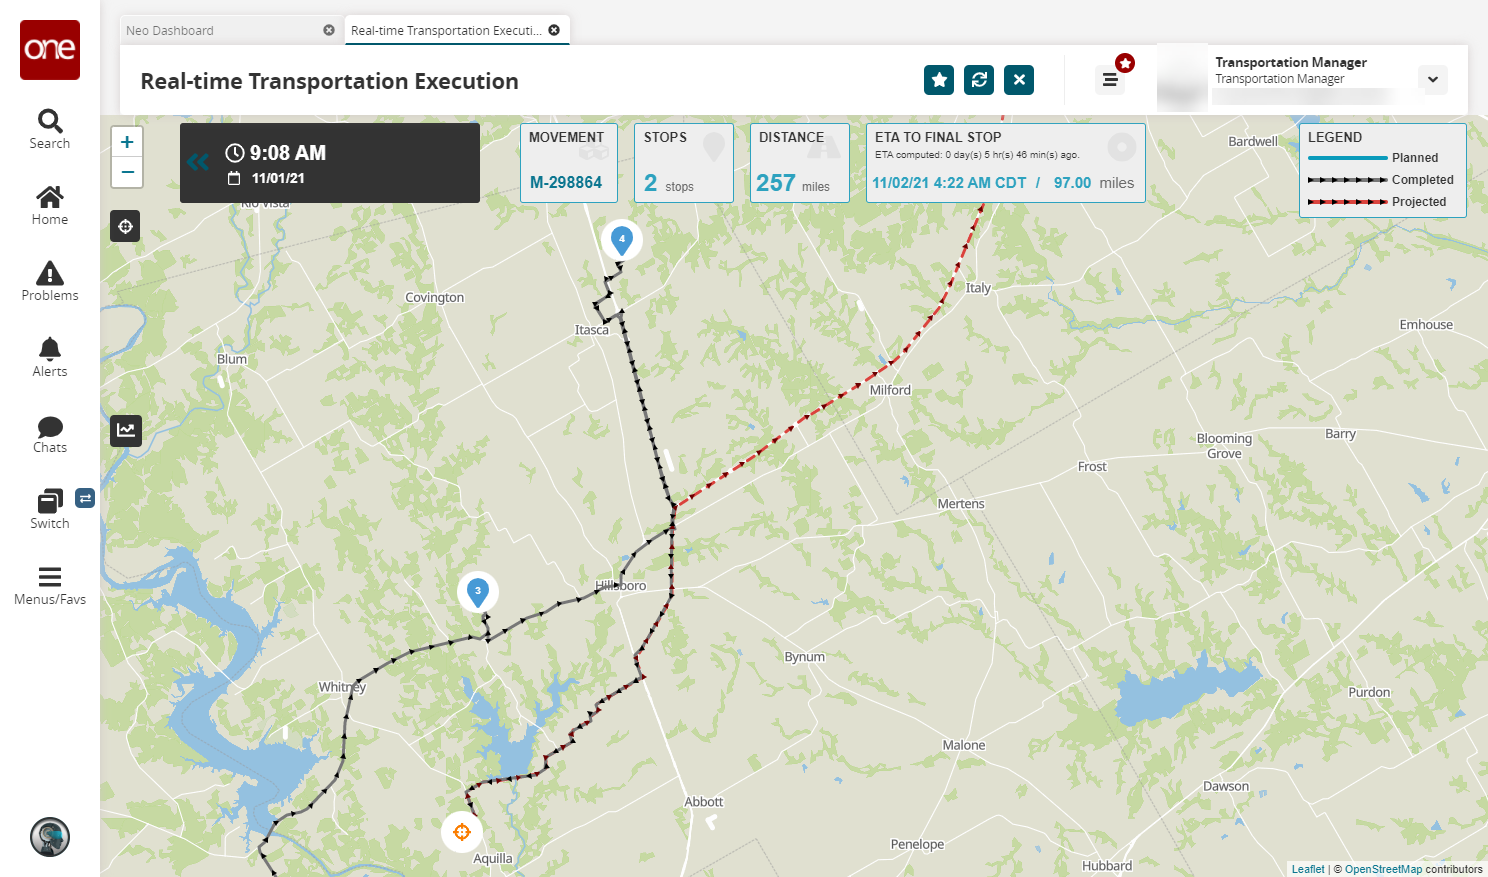
A map of the planned route appears.Click the dark Track icon on the left side of the map to view the actual location history of the movement.
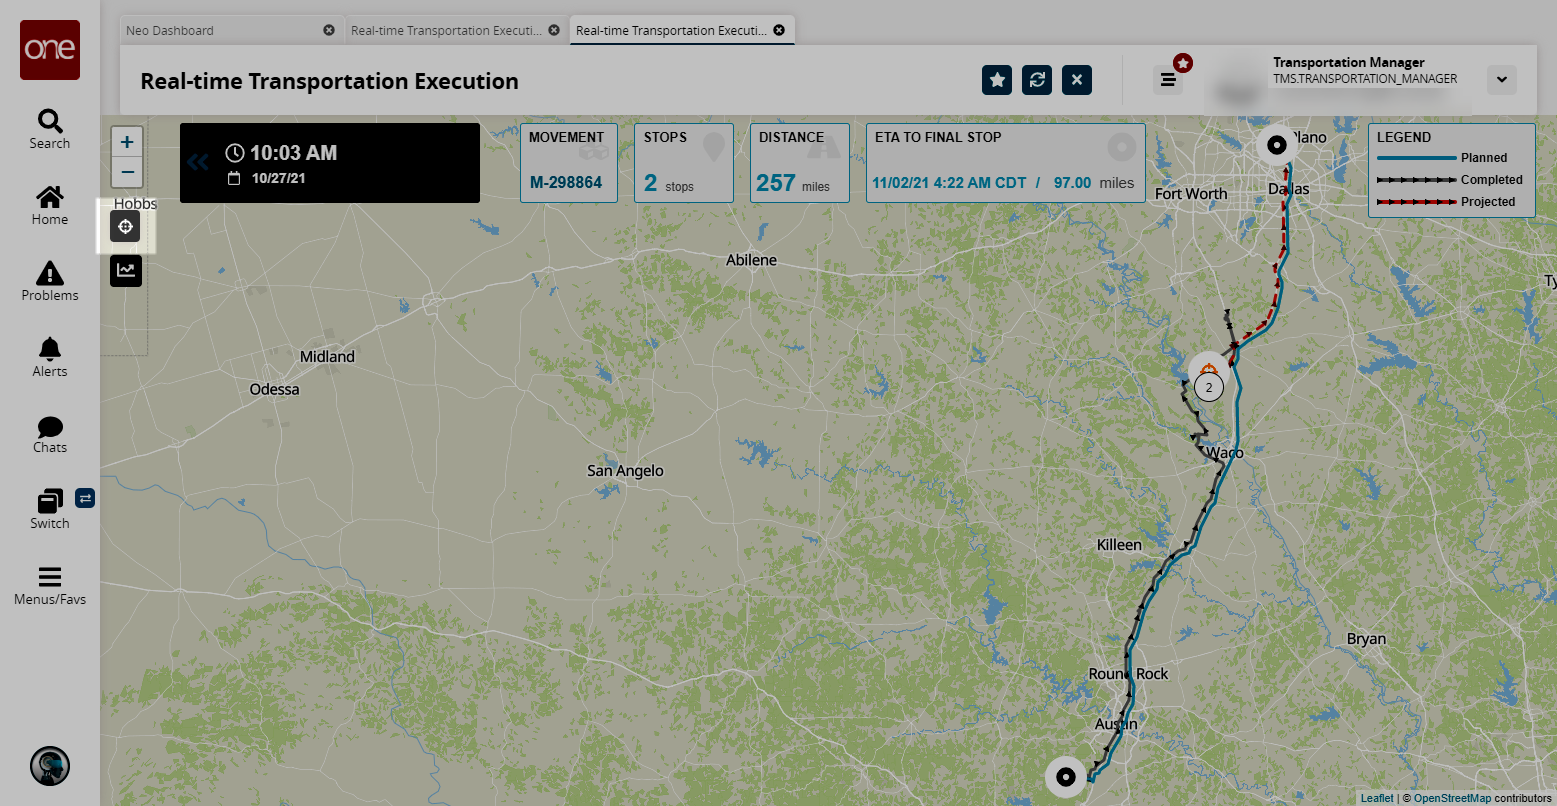
The map updates with location breadcrumbs of the actual location history of the shipment.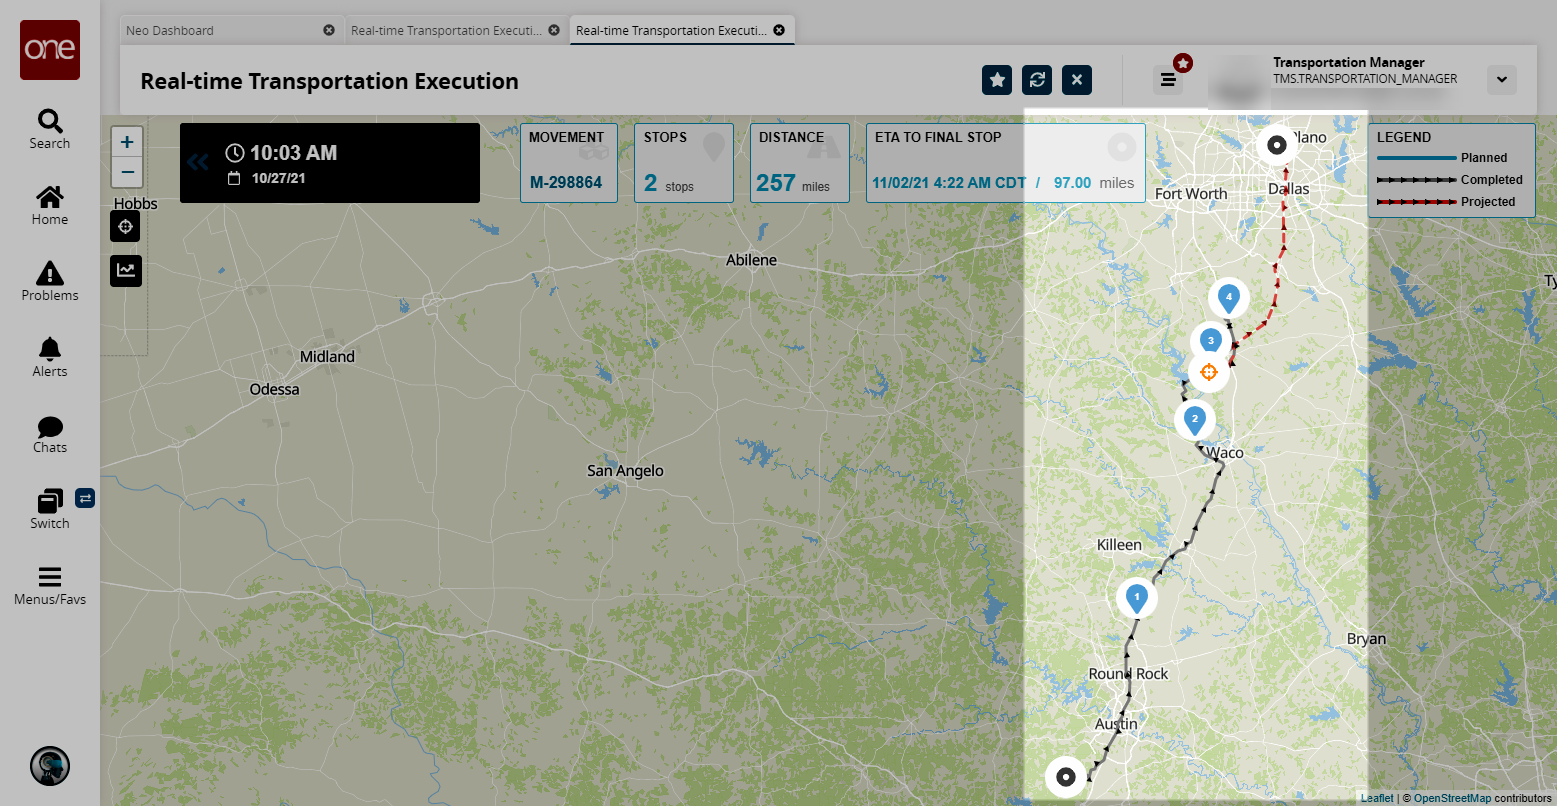
Select a blue, numbered icon to view the telemetry data for that data point. These icons indicate the progress of the movement with numbers increasing with each "current position" update.
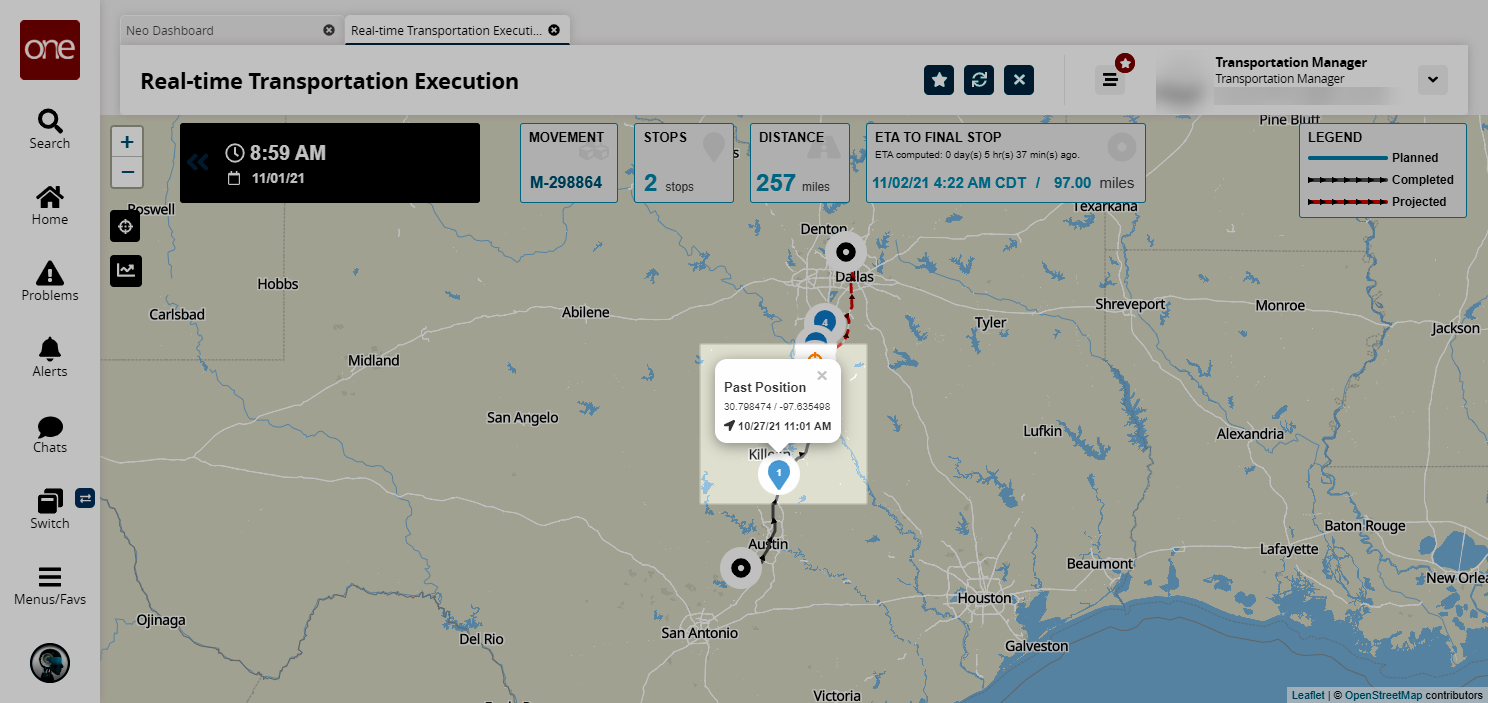
Click the Track icon
 to view the date and time when the last current position of a movement was updated.
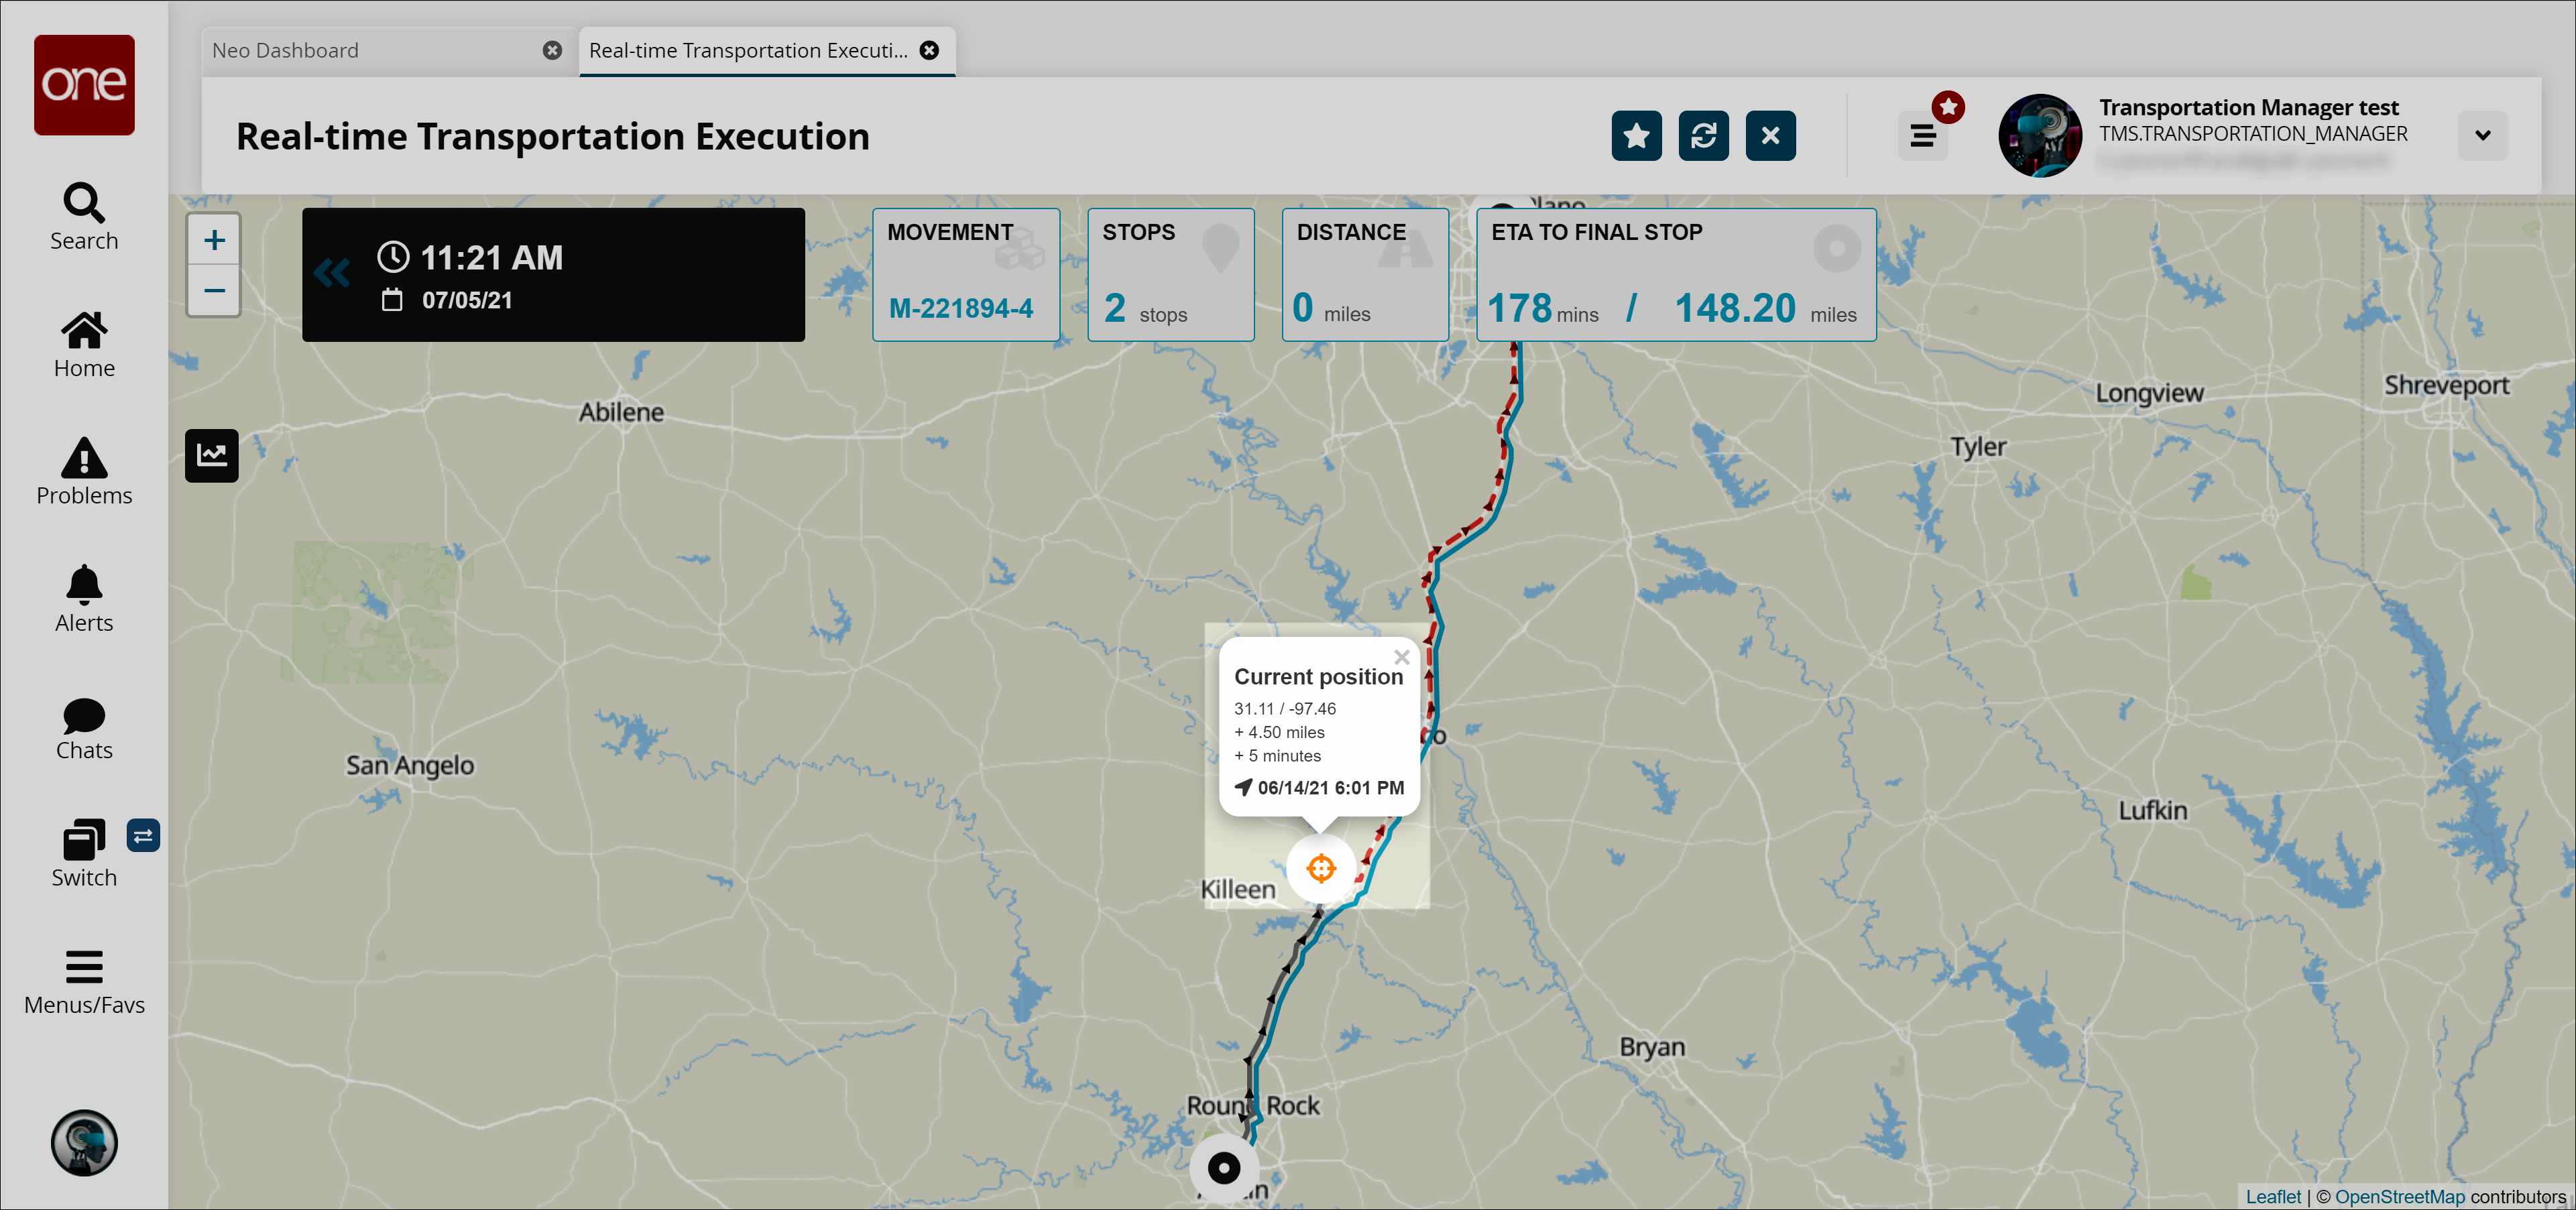
Zooming in this particular movement, you can see the driver went from location 3 to location 4
  to the current location
. The screenshot below shows the driver's completed path (in gray) along with the projected path (in red).
to the current location
. The screenshot below shows the driver's completed path (in gray) along with the projected path (in red).