Configuring NEO Widgets
Introduction
This tutorial will teach you the basics of how to do the following:
Create different types of Neo Widgets:
KPI Widget
Analytical (Pivot) Widget
State Summary Widget
Report Widget
Shortcut Widget
Create a Widget Category
Configure a Neo Dashboard
Persist the Neo Dashboard to the module's source code
Initial Setup
This section walks through how to set up prerequisite data and configurations used in the tutorial.
Install and Start the SDK
In order to follow along with this tutorial, you will need the SDK version NEO 3.2 or higher. If you do not already have the SDK installed, then install it now:
Navigate to https://www.onenetwork.com/dev-net/developer-resource-center/
Click "Register for a Free Account Now" if you do not yet have a Developer Network account. Or click "Login to DevNet" if you do already have an account.
Sign in to the Developer Network portal.
Download the latest version of the SDK.
Double click on the SDK installer and follow the installation prompts.
From the Windows start menu, select "One Studio".
Create a Module
From the Studio menu, select File → New → Platform Module.
Fill in the following values:
Module Name: ExpenseTracker
Source Code Package: com.onenetwork.expensetracker
Request Module Prefix: EXTR
Keep "Create sample dataset" checked.

Click Finish.
Create a Data Model
In Package Explorer, right-click on the "ExpenseTracker" module name.
Select New → Model
Fill in the following values:
Project: ExpenseTracker (This will default to the name of your module.)
Model Name: Transaction

Click Finish.
In Package Explorer, expand ExpenseTracker → models.
Double click on "Transaction.model".
Type in a Description: This model stores expense transactions.
Select the Fields tab.
Add these fields:
UniqueID - Integer
Set Key Field to Natural Key - required
Check Auto-increment
Name - String
Price - Monetary
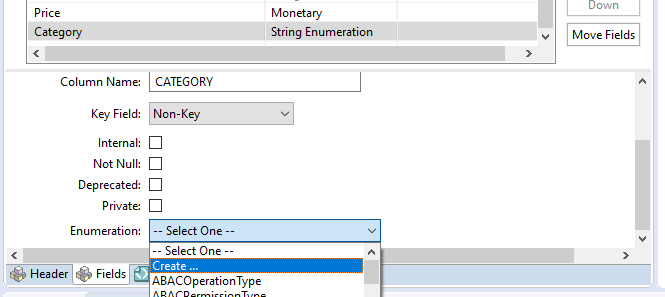
Category - String Enumeration
Create a new string enumeration called TransactionCategories.
With Category selected, choose "Create ..." in the Enumeration drop down box.
Enter the name " TransactionCategories".
Click OK.
Add these values to the enumeration:
Food
Transportation
Utilities
Entertainment

Save changes to the string enumeration.
TransactionDate - Date
State - State
Note: this field is required for State Summary type widgets.
Save the changes to the model.
Build the Module
Open the Ant Dos prompt by running the file ant_dos.bat
In the Ant Dos prompt, change directory to your module: cd ExpenseTracker
Run: ant build
You should receive a "Build Successful" message once the process completes. If you get any errors, then debug those errors and run the build process again.

Start the Server
In the Ant Dos prompt, change the directory to the module's location if you are not already there.
Run: ant run-server-jdwp
The server will take a few minutes to start.
Configure the State Machine for Our Data Model
In order to create a State Summary type of widget, we will need to configure the State Machine for our Data Model.
In Package Explorer, double click on Module Process Template.mpt under our ExpenseTracker module.
In the Outline tab on the right-hand side of Studio, expense Module Process Type (ExpenseTracker) → ExpenseTracker
Click on Transaction.
Enable an action:
Select the Actions tab at the bottom.
Click Add under Actions.
Set the following:
Name: Update
Type: Write
Write Type: Standard
Include in State Diagram: checked
System of Control: checked
Allow Ent Role Customization: checked
Disable Bulk UI Edits: unchecked
Launch Workflow: N/A
Description: This action updates a Transaction record.
Private: checked
Action Screen Handline: Skip Detail Action Screen (Without Confirm)

Click OK.
Add the States and Transition:
Choose the State Machine tab at the bottom.
Select the State option.
Click in the work area to add a new State.
Name this state "Entered".
Select the State option again.
Click in the work area to add a second new State.
Name this state "Confirmed".
Select the Transition option.
Click on Entered and then on Confirm to add the transition.

Save the changes.

Submit the Module Process Template to the server.
Click the submit to server button.

A dialog in the bottom right of Studio will turn green when the changes have been uploaded to the running server.

Set up a Data File to Load Transactions
Create a data file called Transactions.xml
In the Package Explorer window of Studio, expand ExpenseTracker_dataset.
Right-click on the data folder.
Select New → File.
Name the file: Transactions.xml
Add the following text to that data file.
<ModelList xmlns="http://www.onenetwork.com/Platform"xmlns:vc="http://www.onenetwork.com/Platform"><ValueChainId>9123</ValueChainId><CustomModelName>Standard EXTR.Transaction</CustomModelName><ActionName>PLT.Create</ActionName><Transaction xmlns="http://www.expensetracker.onenetwork.com/ExpenseTracker"><ValueChainId>9123</ValueChainId><Name>Kroger</Name><PriceAmount>34.99</PriceAmount><PriceUOM>USD</PriceUOM><Category>Food</Category><State>Entered</State></Transaction><Transaction xmlns="http://www.expensetracker.onenetwork.com/ExpenseTracker"><ValueChainId>9123</ValueChainId><Name>Bank of America</Name><PriceAmount>250.00</PriceAmount><PriceUOM>USD</PriceUOM><Category>Transportation</Category><State>Entered</State></Transaction><Transaction xmlns="http://www.expensetracker.onenetwork.com/ExpenseTracker"><ValueChainId>9123</ValueChainId><Name>City of Farmers Branch</Name><PriceAmount>90.00</PriceAmount><PriceUOM>USD</PriceUOM><Category>Utilities</Category><State>Confirmed</State></Transaction><Transaction xmlns="http://www.expensetracker.onenetwork.com/ExpenseTracker"><ValueChainId>9123</ValueChainId><Name>Netflix</Name><PriceAmount>15.99</PriceAmount><PriceUOM>USD</PriceUOM><Category>Entertainment</Category><State>Confirmed</State></Transaction><Transaction xmlns="http://www.expensetracker.onenetwork.com/ExpenseTracker"><ValueChainId>9123</ValueChainId><Name>Del Friscos</Name><PriceAmount>99.99</PriceAmount><PriceUOM>USD</PriceUOM><Category>Food</Category><State>Confirmed</State></Transaction></ModelList>Save the changes to the Transactions.xml file.
Add a reference to Transactions.xml in the LoadData.xml file.
Double click on the LoadData.xml file.
Add the following line with the other ModelFile elements (above the </LoadData> line):
<ModelFile>data/Transactions.xml</ModelFile>Note: You have more than one module if, for example, you are doing multiple tutorials in the same environment. If so, then remove the ValueChain line from your LoadData.xml file. Otherwise, you will get an error when attempting to run the load-data target.
Save the changes to the LoadData.xml file.

Load the Data
Once the server has started, you can load the data.
In the Ant Dos prompt, change directory to your dataset: cd ExpenseTracker_dataset
Run: ant load-data
You should receive a "Build Successful" message once the process completes. If you get any errors, then debug those errors and run the build process again.

Creating a KPI Widget
In this section, we will add a KPI Widget. These widgets show a single numeric value to the user.
Example of a KPI widget:

Create a Report to Select the Data for our KPI Widget
Create a reports file called TransactionTotal.reports.
In the Package Explorer window of Studio, right-click on the "reports" folder of the ExpenseTracker module.
Select New → File.
Name the file
Add the following report to the file:
<?xml version="1.0"encoding="UTF-8"?><ReportList xmlns="http://www.onenetwork.com/Platform"><Report><Name>TransactionTotal</Name><SqlDef Name="TransactionTotal"GroupName="SampleSqls"><![CDATA[SELECTSUM(PRICE_AMOUNT) AS PRICE_TOTAL,PRICE_UOMfrom EXTR_TRANSACTIONGROUP BYPRICE_UOM]]></SqlDef><Retrieval><CustomRetrievalField><FieldRef levelType="EXTR.Transaction"category="PDF"><FieldName>PriceAmount</FieldName></FieldRef><Hidden>false</Hidden><Type>STRING</Type><SimpleMapping sqlName="PRICE_TOTAL"/></CustomRetrievalField><CustomRetrievalField><FieldRef levelType="EXTR.Transaction"category="PDF"><FieldName>PriceUOM</FieldName></FieldRef><Hidden>false</Hidden><Type>STRING_ENUMERATION</Type><EnumerationType>CurrencyCode</EnumerationType><SimpleMapping sqlName="PRICE_UOM"/></CustomRetrievalField></Retrieval></Report></ReportList>Save the changes.
Submit the reports to the server.
Click the submit to server button.

A dialog in the bottom right of Studio will turn green when the changes have been uploaded to the running server.
Configure a KPI Type Widget in the UI Meta Model
In the Package Explorer window of Studio, double click on "Module Process Template.mpt" under the ExpenseTracker module.
Make sure Module Process Type (ExpenseTracker) is selected in the Outline tab in the upper right.
Select the UiMetaModel tab.
Add the NeoWidgetType
Under the WebInfo element add the following NeoWidetType element:
<NeoWidgetType name="MoneySpent"componentPath="PLT/Widgets/KPI"><AllowedLayouts>COLUMNAR,FIXED,FLEXIBLE</AllowedLayouts><PreviewImagePath>/oms/img/neo/widgets/kpi/kpi1.png</PreviewImagePath><Config>{"reportName":"EXTR.TransactionTotal","valueColumnName":"EXTR$Transaction$PriceAmount","uomColumnName":"EXTR$Transaction$PriceUOM","severityColumnName":"Undefined$PRICE_AMOUNT","emptyValue":"0",filters: {filters: {"Undefined$Timeline_displayValue":"Money Spent","Undefined$Timeline":"Money Spent"}}}</Config></NeoWidgetType>The following is an explanation of the parameters:
AllowedLayouts defines how the widget can be added to Neo dashboards.
PreviewImagePath defines a path to an image that the user sees when choosing the widget to add.
Config contains JSON formatted settings specific to this type of widget. For a KPI type widget, these are:
reportName = Name of the report where kpi data is retrieved from.
valueColumnName = The name of the report column with the actual KPI number value. Only used when reportName is specified. Defaults to 'Undefined$Count'.
uomColumnName = The name of the report column with the KPI value UOM. Only used when reportName is specified.
severityColumnName = The name of the report column with the KPI severity level. Only used when reportName is specified. Defaults to 'Undefined$Severity'.
emptyValue = The value to show in UI when there's no KPI data (e.g. when related report returned 0 rows or row is returned without mapped KPI value). Defaults to 0. Can be defined as the internationalized value (key).
filters = filters to use while fetching KPI data from report. Only used when reportName is specified.
kpiDefName = KPI def name to fetch data from.
customIndicatorColumnName = The name of a report column with additional info to show in UI. Only used when reportName and customIndicatorTooltipColumnName are specified.
customIndicatorTooltipColumnName = The name of a report column with tooltip text to show in UI for custom indicator. Only used when reportName and customIndicatorColumnName are specified.
Add a new NeoWidgetCategory
Underneath the last NeoWidgetType element, add the following NeoWidgetCategory element.
<NeoWidgetCategory name="ExpenseTrackerWidgets"><RoleTypeRef><IntrinsicRoleType>EXTR.SampleRoleType</IntrinsicRoleType></RoleTypeRef><NeoWidgetTypeRef name="MoneySpent"/></NeoWidgetCategory>This configures a new category of widgets that the user can choose from when they are adding a widget to a Neo dashboard.
The name attribute is the name displayed to the user.
The InstrinsicRoleType element(s) defines which user Role Types can see this widget group.
NeoWidgetTypeRef adds the widget to the group. The name attribute of this element should correspond with the name of a NeoWidgetType element
Save the changes.
Submit the changes to the server.
Click the submit to server button.
A dialog in the bottom right of Studio will turn green when the changes have been uploaded to the running server.
Configure the Labels for our KPI Widget and our Widget Category
In the Package Explorer window of Studio, double click on "messages.properties" under in the the ExpenseTracker module.
This is found in the folder: web/cfg/war/bundle/
Add the following text.
meta.NeoWidgetCategory.EXTR.ExpenseTrackerWidgets=Expense Tracker Widgetsmeta.NeoWidgetType.EXTR.MoneySpent.name=Money Spentmeta.NeoWidgetType.EXTR.MoneySpent.description=Money Spent WidgetSave the changes.

Submit the changes to the server.
Click the submit to server button.
A dialog in the bottom right of Studio will turn green when the changes have been uploaded to the running server.
Put the KPI Widget on the Dashboard
Log in to the App:
Open a web browser.
Navigate to http://localhost
Sign in:
Username: ExpenseTrackerUser
Password: password
Create a Neo Dashboard:
Starting from the Home screen of the app, click on the New Dashboard button in the upper right.

Give the new dashboard a name and click Confirm.

Add a Layout
The new dashboard will open with Edit mode active.
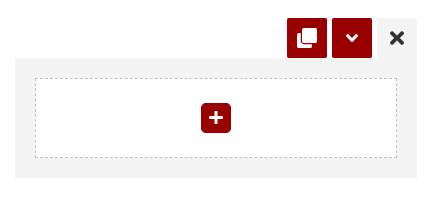
Click Add Columnar Layout to add a layout.

A new layout will be added to the dashboard.

Add the new Widget.
Click the plus sign in the leftmost column

Scroll down to the widget category we created in the previous section.

Click Add Widget.
The widget will appear in the dashboard.
Click the Save the Dashboard button at the top to exit dashboard edit mode.

Creating an Analytical (Pivot) Widget
In this section, we will add an Analytical (Pivot) widget. These widgets show a visualization of data. They also are available with many different visualization options.
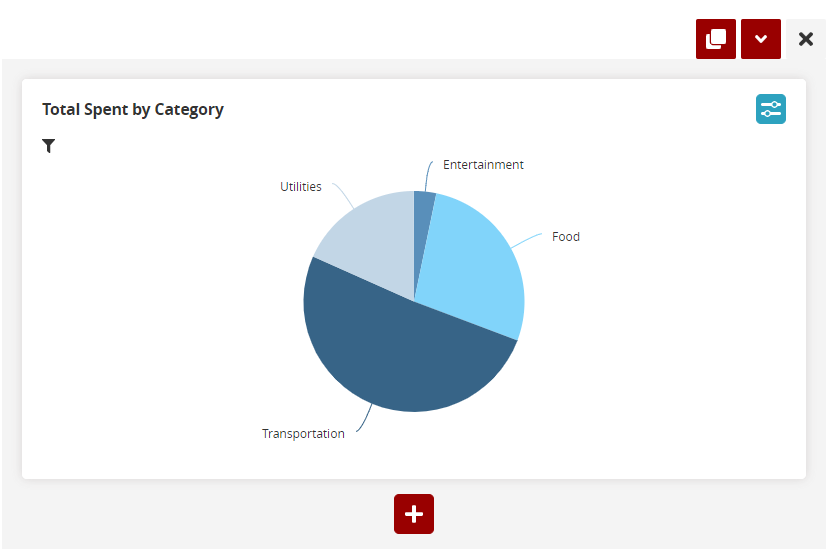
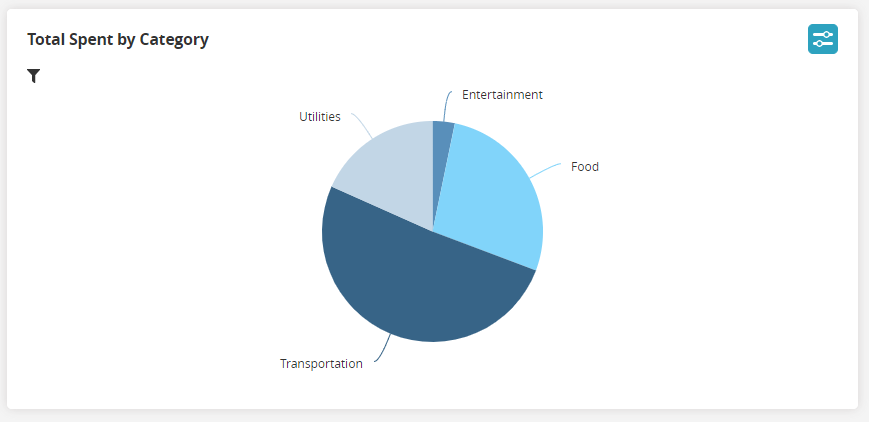
Example of an Analytical (Pivot) widget:

Prerequisite for Analytical (Pivot) Widgets
Creating an Analytical (Pivot) widget requires Flexmonster, a third-party tool, to be enabled for your internet domain.
For more information about Flexmonster, see: http://www.flexmonster.com/
Create a Report for our Analytical (Pivot) Widget
Create a reports file called TransactionsByCategory.reports.
In the Package Explorer window of Studio, right-click on the "reports" folder of the ExpenseTracker module.
Select New → File.
Name the file
Add the following report to the file:
<?xml version="1.0"encoding="UTF-8"?><ReportList xmlns="http://www.onenetwork.com/Platform"><Report><Name>TransactionsByCategory</Name><SqlDef Name="TransactionsByCategory"GroupName="SampleSqls"><![CDATA[SELECTCATEGORY,PRICE_AMOUNT AS PRICE_TOTALfrom EXTR_TRANSACTION]]></SqlDef><Filters bindSqlNulls="true"><CustomFilterField><FieldRef category="PDF"levelType="EXTR.Transaction"><FieldName>Category</FieldName></FieldRef><Type>STRING</Type><SimpleMapping sqlName="CATEGORY"/></CustomFilterField></Filters><Retrieval><CustomRetrievalField><FieldRef levelType="EXTR.Transaction"category="PDF"><FieldName>Category</FieldName></FieldRef><Type>STRING</Type><SimpleMapping sqlName="Category"/></CustomRetrievalField><CustomRetrievalField><FieldRef levelType="EXTR.Transaction"category="PDF"><FieldName>PriceAmount</FieldName></FieldRef><Type>FLOAT</Type><SimpleMapping sqlName="PRICE_TOTAL"/></CustomRetrievalField></Retrieval><Pivot><PivotName>TransactionsByCategory</PivotName><Rows><FieldName>Category</FieldName></Rows><Measures><FieldName>PriceAmount</FieldName></Measures><ChartsEnabled>true</ChartsEnabled><ChartsActive>true</ChartsActive><ChartType>pie</ChartType></Pivot></Report></ReportList>Save the changes.
Submit the reports to the server.
Click the submit to server button.

A dialog in the bottom right of Studio will turn green when the changes have been uploaded to the running server.
Configure an Analytical (Pivot) Type Widget in the UiMetaModel
In the Package Explorer window of Studio, double click on "Module Process Template.mpt" under the ExpenseTracker module.
Select the UiMetaModel tab.
Add the NeoWidgetType
Under the WebInfo element add the following NeoWidetType element:
<NeoWidgetType name="TotalSpentByCategory" componentPath="PLT/Widgets/PivotWidget"> <PreviewImagePath>/oms/img/neo/widgets/pivot/pivot2.png</PreviewImagePath> <Config> { "reportName": "EXTR.TransactionsByCategory", "editableFilters":true, "showFilterSummary": true, "pivotConfig": { "toolbarEnabled": true, "hideChartConfigPanel": false, "options": { "configuratorButton": true } } } </Config></NeoWidgetType>The following is an explanation of the parameters:
AllowedLayouts = This defines how the widget can be added to Neo dashboards.
PreviewImagePath = This defines a path to an image that the user sees when choosing the widget to add.
Config contains JSON formatted settings specific to this type of widget. For our analytical (pivot) type widget, these are:
reportName = The name of the report which defines the data
editableFilters = Whether or not to allow the user to change the filters in the user interface
showFilterSummary = Whether or not to show a summary of the filters underneath the widget's name
pivotConfig
toolbarEnabled = Whether or not to display a pivot toolbar at the top of the widget
hideChartConfigPanel = Whether or not to display a filter toolbar above the widget's graph
options
configuratorButton = Whether or not to show an array shaped button which allows the users to change pivot settings
filters = A set of named default filters that will be applied to the filter panel and report when generating the pivot.
Add a NeoWidgetTypeRef to our NeoWidgetCategory
Underneath the last NeoWidgetType element, find the NeoWidgetCategory element we created earlier. We named it "KPI Widgets".
Add a new NeoWidgetTypeRef for our Analytical (Pivot) widget.
-
<NeoWidgetCategory name="KPI Widgets"><RoleTypeRef><IntrinsicRoleType>EXTR.SampleRoleType</IntrinsicRoleType></RoleTypeRef><NeoWidgetTypeRef name="MoneySpent"/><NeoWidgetTypeRef name="TotalSpentByCategory"/></NeoWidgetCategory>
Save the changes.
Submit the changes to the server.
Click the submit to server button.
A dialog in the bottom right of Studio will turn green when the changes have been uploaded to the running server.
Configure the Labels for our Analytical (Pivot) Widget
In the Package Explorer window of Studio, double click on "messages.properties" under the ExpenseTracker module.
This is found in the folder: web/cfg/war/bundle/
Add the following text.
meta.NeoWidgetType.EXTR.TotalSpentByCategory.name=Total Spent by Categorymeta.NeoWidgetType.EXTR.TotalSpentByCategory.description=This is a chart showing the total spent by category.Save the changes.
Submit the changes to the server.
Click the submit to server button.
A dialog in the bottom right of Studio will turn green when the changes have been uploaded to the running server.
Put the Analytic (Pivot) Widget on the Dashboard
Navigate to http://localhost in your web browser.
Enable edit mode: Click on the pencil icon at the top of the screen.

Add the new Widget.
Click the plus sign in the rightmost column
Scroll down to the widget category we created in an earlier section.
Click Add Widget for the "Total Spent by Category" widget.

The widget will appear in the dashboard.
Click the Save the Dashboard button at the top to exit dashboard edit mode.

Adjust the Settings for our Analytical (Pivot) Widget
This example displays the chart as a Pie chart. To use a different type of chart, edit the report's Pivot ChartType to change it.
In the Package Explorer window of Studio, find the reports folder of the ExpenseTracker module.
Double click on TransactionByCategory.reports file.
Change ChartType to the type of chart that you want to show.

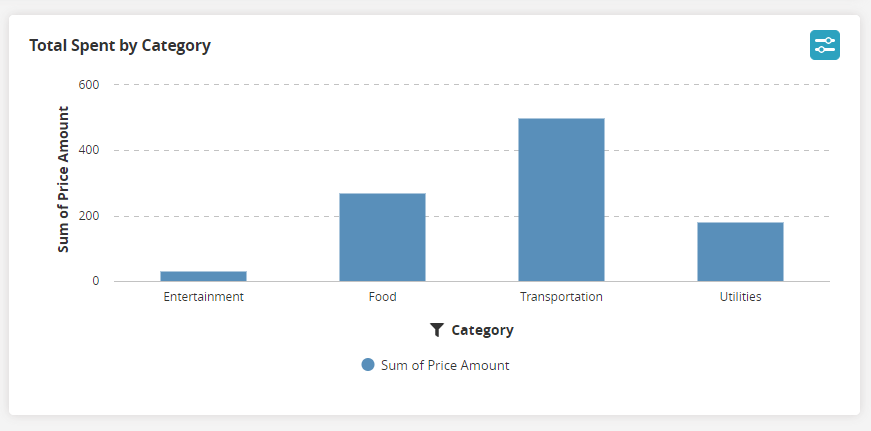
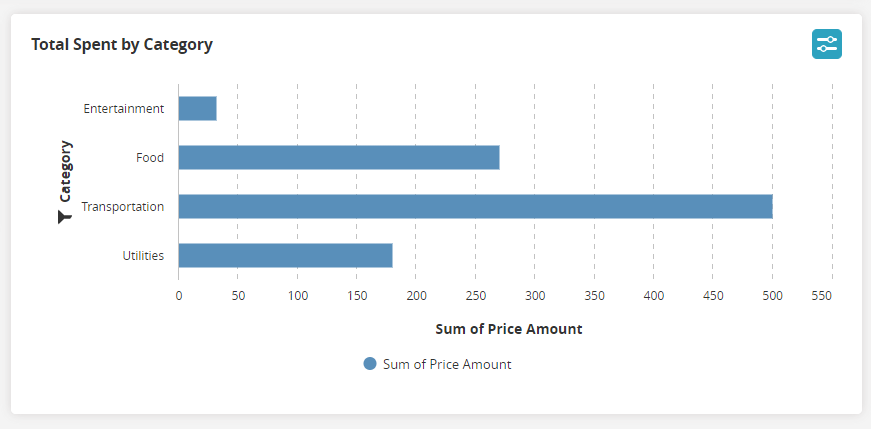
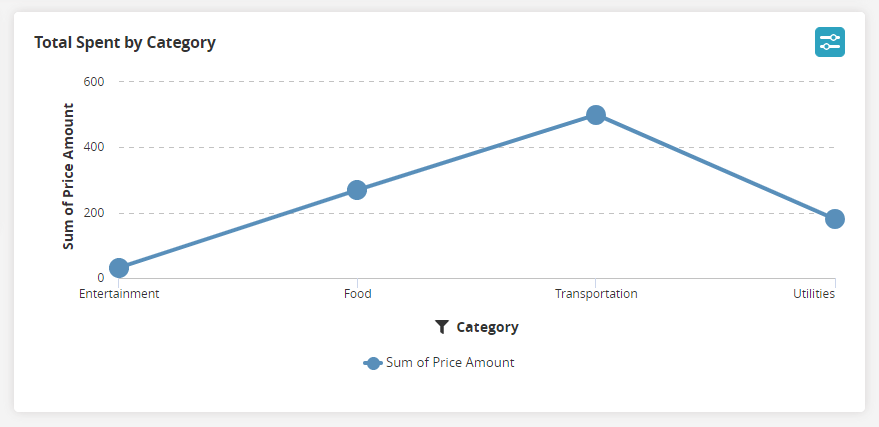
Some examples of chart types are shown here:
pie
column
bar
line
Special Notes About Configuring Measures:
Our widget only has one Measure set for it (PriceAmount).
If we want to use the "scatter", "pie", or "bubble" chart types then we would need to add more than one Measure.
Measures can be added in the report like we did for PriceAmount.
Measures can alternatively be added by as slice → measures in the pivotConfig section of the NeoWidgetTypes' Config in the UiMetaModel.
Example (for illustration purposes only):
slice: { measures: [ { uniqueName: "Orders Fulfilled", formula: "DISTINCTCOUNT('ORDER_ID')", individual: true, caption: "Orders Fulfilled", active: true }, { uniqueName: "Products Supplied", formula: "'ORD_QUANTITY' * 'PROD_UNIT_PRICE'", aggregation: "sum", individual: true, caption: "Total Amount of Products Supplied", active: true } ]Creating a State Summary Widget
In this section, we will add a State Summary widget. These types of widgets show information about how many records are in different states.
Example of a State Summary widget:

Note: A State Summary widget requires the associated Data Model to have a State field.
Create a Report for our State Summary Widget
Create a reports file called TransactionStates.reports.
In the Package Explorer window of Studio, right-click on the "reports" folder of the ExpenseTracker module.
Select New → File.
Name the file
Add the following report to the file:
<?xml version="1.0"encoding="UTF-8"?><ReportList xmlns="http://www.onenetwork.com/Platform"><Report><Name>TransactionStates</Name><SqlDef Name="TransactionStates"GroupName="SampleSqls"><![CDATA[SELECTSTATE, count(STATE) AS COUNTFROM EXTR_TRANSACTIONWHERE STATE IS NOT NULLGROUP BY STATEORDER BY STATE DESC]]></SqlDef><Retrieval><CustomRetrievalField><FieldRef levelType="Transaction"category="PDF"><FieldName>STATE</FieldName></FieldRef><Hidden>false</Hidden><Type>STRING</Type><SimpleMapping sqlName="STATE"/></CustomRetrievalField><CustomRetrievalField><FieldRef levelType="Transaction"category="PDF"><FieldName>COUNT</FieldName></FieldRef><Hidden>false</Hidden><Type>STRING</Type><SimpleMapping sqlName="COUNT"/></CustomRetrievalField></Retrieval></Report></ReportList>Save the changes.
Submit the reports to the server.
Click the submit to server button.
A dialog in the bottom right of Studio will turn green when the changes have been uploaded to the running server.
Add the State Summary Widget to the UiMetaModel
In the Package Explorer window of Studio, double click on "Module Process Template.mpt" under the ExpenseTracker module.
Select the UiMetaModel tab.
Add the NeoWidgetType
Under the WebInfo element add the following NeoWidetType element:
<NeoWidgetType name="TransactionStateSummary" componentPath="PLT/Widgets/StateSummary"> <PreviewImagePath>/oms/img/neo/widgets/statesummary/statesummary4.png</PreviewImagePath> <Config>{ "reportName": "EXTR.TransactionStates", "stateField": "Transaction$STATE", "countFields": ["Transaction$COUNT"], "modelLevelType": 'Transaction' }</Config></NeoWidgetType>The following is an explanation of the available parameters:
PreviewImagePath defines a path to an image that the user sees when choosing the widget to add.
Config contains JSON formatted settings specific to this type of widget. For our analytical (pivot) type widget, these are:
reportName = The name of the report which defines the data
stateField = The name of the data field which defines records' states
countFields = An array of field names with numeric counts.
nonChainedStates = An array of field names where you do not want arrows showing state names connected.
For example, you could add the following to the example above:
"nonChainedStates": ["Entered","Confirmed"],This would make the widget appear as follows:

plugins = An array of one or more plugins, each of which should be an object which can contain the following functions:
onStateClick = Callback which is called when the user clicks on a state label. It is passed the store and the state as the only parameters and expects no return value.
onCountClick = Callback which is called when the user clicks on a state count. It is passed the store, the state, and the count object, and expects no return value.
modelLevelType = model key prefix to use to internationalize state value
stateI18nPrefix = i18n key prefix to use to internationalize state value (e.g. - 'meta.field.State.')
AllowedLayouts defines how the widget can be added to Neo dashboards.
Add a NeoWidgetTypeRef to our NeoWidgetCategory
Underneath the last NeoWidgetType element, find the NeoWidgetCategory element we created earlier. We named it "KPI Widgets".
Add a new NeoWidgetTypeRef for our Analytical (Pivot) widget.
<NeoWidgetTypeRef name="TransactionStateSummary"/>
Save the changes.
Submit the changes to the server.
Click the submit to server button.
A dialog in the bottom right of Studio will turn green when the changes have been uploaded to the running server.
Add labels for the State Summary Widget
In the Package Explorer window of Studio, double click on "messages.properties" under the ExpenseTracker module.
This is found in the folder: web/cfg/war/bundle/
Add the following text.
meta.NeoWidgetType.EXTR.TransactionStateSummary.name=Transaction State Summarymeta.NeoWidgetType.EXTR.TransactionStateSummary.description=This widget shows how many transactions are in each state.Save the changes.
Submit the changes to the server.
Click the submit to server button.
A dialog in the bottom right of Studio will turn green when the changes have been uploaded to the running server.
Put the State Summary Widget on the Dashboard
Navigate to http://localhost in your web browser.
Enable edit mode:
Click on the pencil icon at the top of the screen.
Add the new Widget.
Click the plus sign under our KPI widget:

Scroll down to the widget category we created in an earlier section.
Click Add Widget for the "Transaction State Summary" widget.

The widget will appear in the dashboard.
Click the Save the Dashboard button at the top to exit dashboard edit mode.
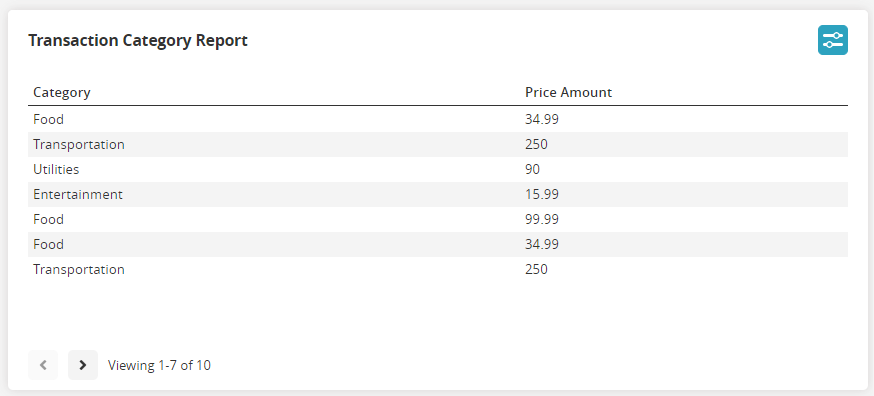
Creating a Report Widget
A report widget shows a table of data in a widget. This widget can be filtered by the user. It also includes pagination of data.

Create a Report
The first step is to create a report. We already created reports in an earlier step, so we will just use one of those for illustration. Let's use the report "TransactionsByCategory".
For more information on how to create reports, please see the Report documentation: Reports - Developer Network Documentation (onenetwork.com)
Add the Report Widget to the UiMetaModel
In the Package Explorer window of Studio, double click on "Module Process Template.mpt" under the ExpenseTracker module.
Select the UiMetaModel tab.
Add the NeoWidgetType
Under the WebInfo element add the following NeoWidetType element:
<NeoWidgetType name="TransactionsReport" componentPath="PLT/Widgets/ReportWidget"> <PreviewImagePath>/oms/img/neo/widgets/summarylist/summarylist1.png</PreviewImagePath> <Config> { "reportName": "EXTR.TransactionsByCategory", "height": 250 } </Config></NeoWidgetType>The following is an explanation of the available parameters:
PreviewImagePath defines a path to an image that the user sees when choosing the widget to add.
Config contains JSON formatted settings specific to this type of widget. For our analytical (pivot) type widget, these are:
reportName = The name of the report which defines the data.
height: The height of the widget in pixels.
Add a NeoWidgetTypeRef to our NeoWidgetCategory
Underneath the last NeoWidgetType element, find the NeoWidgetCategory element we created earlier. We named it "KPI Widgets".
Add a new NeoWidgetTypeRef for our Analytical (Pivot) widget.
<NeoWidgetTypeRef name="TransactionsReport"/>
Save the changes.
Submit the changes to the server.
Click the submit to server button.
A dialog in the bottom right of Studio will turn green when the changes have been uploaded to the running server.
Add labels for the Report Widget
In the Package Explorer window of Studio, double click on "messages.properties" under the ExpenseTracker module.
This is found in the folder: web/cfg/war/bundle/
Add the following text.
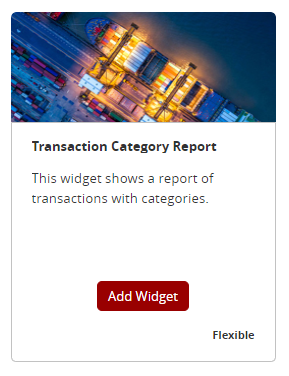
meta.NeoWidgetType.EXTR.TransactionsReport.name=Transaction Category Reportmeta.NeoWidgetType.EXTR.TransactionsReport.description=This widget shows a report of transactions with categories.Save the changes.
Submit the changes to the server.
Click the submit to server button.
A dialog in the bottom right of Studio will turn green when the changes have been uploaded to the running server.
Put the Report Widget on the Dashboard
Navigate to http://localhost in your web browser.
Enable edit mode:
Click on the pencil icon at the top of the screen.
Add the new Widget.
Click the plus icon.
Select the Transaction Category Report widget.
Save the dashboard.

The widget will now be visible.
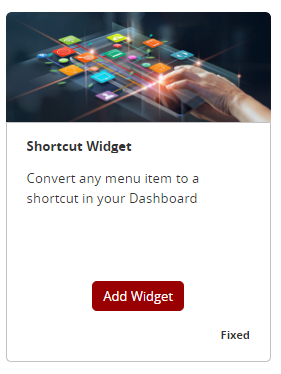
Creating a Shortcut Widget
Shortcut widgets are clickable icons that open a web URL. They are easily added through the web user interface.
Navigate to http://localhost in your web browser.
Enable edit mode:
Click on the pencil icon at the top of the screen.
Click the Add Fixed Layout button to add a fixed layout.
Click the plus icon to add a new widget.

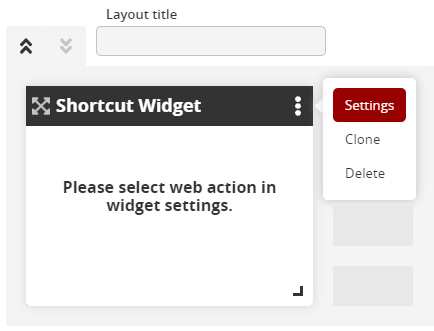
Select the Shortcut Widget. You will find it in the Other Widgets category.
The widget will be added to your dashboard. Click on the vertical ellipses icon and select Settings.
Configure the settings as desired.
Selection Option: This allows you to toggle between a menu option and an external web URL.
Shortcut Name: The name to display to the users.
External Link: The web URL for an external link to open.
Menu Item: The menu item to open.
Image: The image to display on the dashboard.
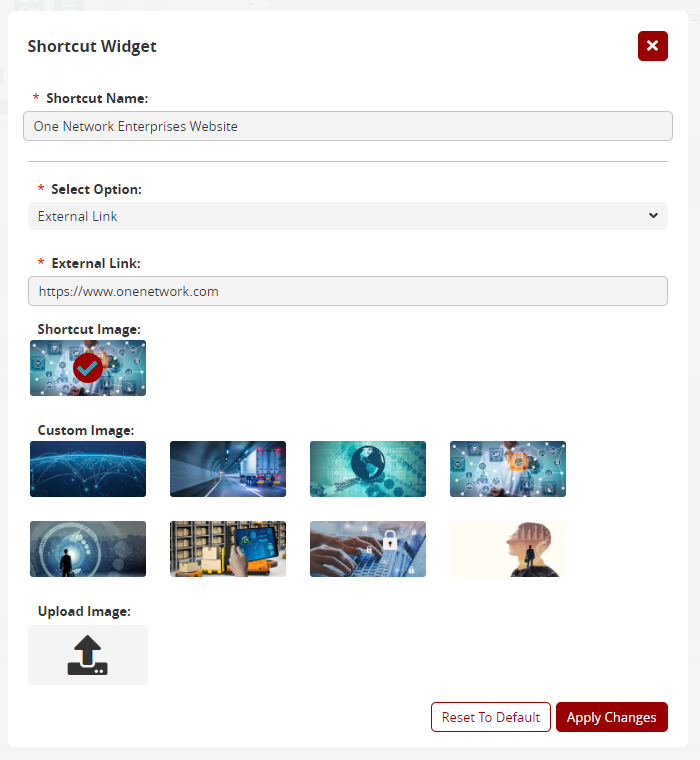
Click Apply changes.
Click and drag the edge of the widget to the size you want.
Save the dashboard.

The widget will now be visible.

Save the Dashboard Configuration in the MPT
After you've designed a dashboard, you will want that dashboard to persist in the source code control system.
Our dashboard should look something like the following:

Click on the View Dashboard Configuration button at the top of the page.

JSON formatted data describing your dashboard will be displayed. Copy that text by clicking on the Copy to Clipboard button.
Go back to the UiMetaModel tab of the Module Process Template in Studio.
Under the last NeoWidgetCategory element, paste the JSON that we copied from the app's UI in an earlier step. The full NeoPortalDef element will look like the following:
<NeoPortalDef name="DashboardTutorial"isDashboard="true"><DefaultConfig><![CDATA[{"schemaVersion":1,"sections": [{"config": {"colConfigType":"THIRD_LEFT","columns": [[{"_defaultConfig": {"autoRefreshInterval":0},"widgetTypeName":"EXTR.MoneySpent"},{"_defaultConfig": {"autoRefreshInterval":0},"widgetSettings": {"filters": {},"settings": {"showZeroValueStates":true}},"widgetTypeName":"EXTR.TransactionStateSummary"}],[{"_defaultConfig": {"autoRefreshInterval":0},"widgetSettings": {"filters": {}},"widgetTypeName":"EXTR.TotalSpentByCategory"},{"_defaultConfig": {"autoRefreshInterval":0},"widgetSettings": {},"widgetTypeName":"EXTR.TransactionsReport"}]],"schemaVersion":1},"customizedTitle":true,"titleKey":null,"type":"ColumnarLayout"},{"config": {"items": [{"_defaultConfig": {"autoRefreshInterval":0},"customTitle":"One Network Enterprises Website","h":2,"w":2,"widgetSettings": {"customizedTitle":true,"externalLink":"https://www.onenetwork.com","image":3,"selectOption":"externalLink","webAction":""},"widgetTypeName":"PLT.ShortcutWidget","x":0,"y":0}],"schemaVersion":1},"customizedTitle":true,"titleKey":null,"type":"FixedLayout"}]}]]></DefaultConfig></NeoPortalDef>The NeoPortalDef element defines a Neo Dashboard available to users.
The name attribute defines the name that appears in the upper left of the screen.
To make the dashboard the default dashboard for a given role type, you need to add a WebAction that loads the NeoPortalDef you've defined. The WebAction will load a PLT/NeoDashboard React page that knows how to render dashboards, and the name property in the Properties element should correspond to the NeoPortalDef name (and include your module prefix):
<WebAction singleton="true"name="DefaultNeoDashboard"><OneReactPage><ModulePath>PLT/NeoDashboard</ModulePath><Properties>{"name":"EXTR.DashboardTutorial"}</Properties></OneReactPage></WebAction>Then, you need to add a NeoDashboardRef which references the WebAction at the bottom inside each RoleTypeUiConfig you want to configure it for. The name should correspond to the same name used in the WebAction. Example:
<RoleTypeUiConfig menuType="menu"ui="Neo"><RoleTypeRef><IntrinsicRoleType>EXTR.SampleRoleType</IntrinsicRoleType></RoleTypeRef><WebActionGroupRef name="Administration"/>...<NeoDashboardRef name="DefaultNeoDashboard"/></RoleTypeUiConfig>Save the changes to the Module Process Template.

Submit the changes to the server.
To verify that the dashboard is now the "default dashboard", you can delete the record in the NEO_DASHBOARD table in the database that was created for the dashboard you created through the UI. Then refresh Neo UI. Verify that you still see the dashboard you created; this is appearing by default from the configuration you added to the Module Process Template.
This completes the Configuring Neo Widgets tutorial.