Demand Forecast Accuracy By Item
Complete the following steps to view the Demand Forecast Accuracy by Item report:
L og in to the ONE system.
Click Menus/Favs > Demand Planning > Forecast Accuracy > Forecast Accuracy By Site > Demand Forecast Accuracy By Item. In the NEO UI, users can click on the Menus/Favs icon on the left sidebar and type in the name of the screen in the menu search bar. For more information, see "Using the Menu Search Bar."
The Demand Forecast Accuracy By Item screen displays.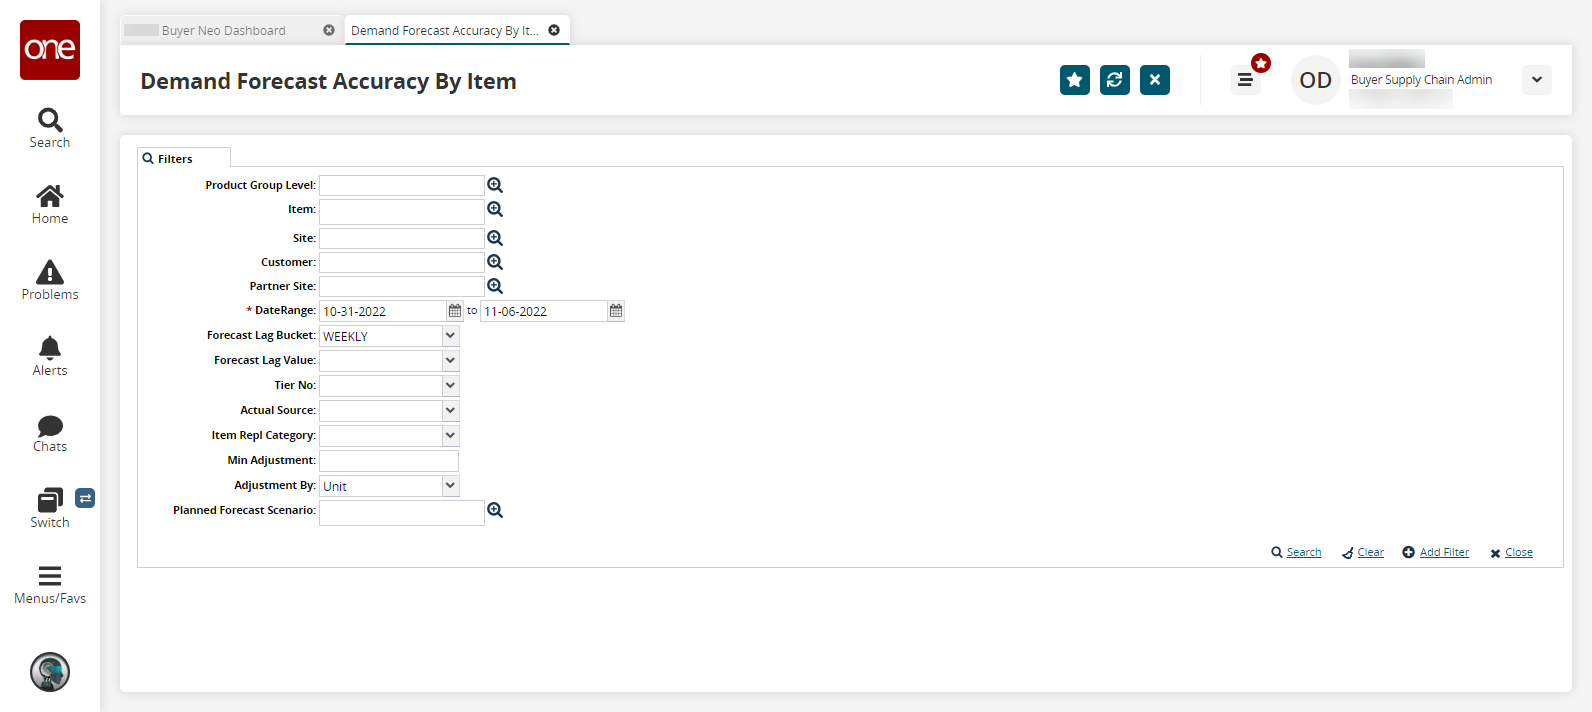
Fill out the following fields. Fields with an asterisk ( * ) are required.
Field
Description
Product Group Level
Enter or select a product group level using the picker tool.
Item
Enter or select an item using the picker tool.
Site
Enter or select a site using the picker tool.
Customer
Enter or select a customer using the picker tool.
Partner Site
Enter or select a partner site using the picker tool.
* Date Range
Select a date range using the calendar tools.
Forecast Lag Bucket
Select a time bucket from the dropdown menu.
Forecast Lag Value
Select a lag value from the dropdown menu.
Tier No
Select a tier number from the dropdown menu.
Actual Source
Select an actual source from the dropdown menu.
Item Repl Category
Select an option from the dropdown menu.
Min Qty Adjustment
Enter a numerical value for the minimum quantity adjustment.
Adjustment By
Select the adjustment unit of measure from the dropdown menu.
Planned Forecast Scenario
Enter or select a planned forecast scenario using the picker tool.
Fill out the filters as desired, and click the Search link.
The search results display.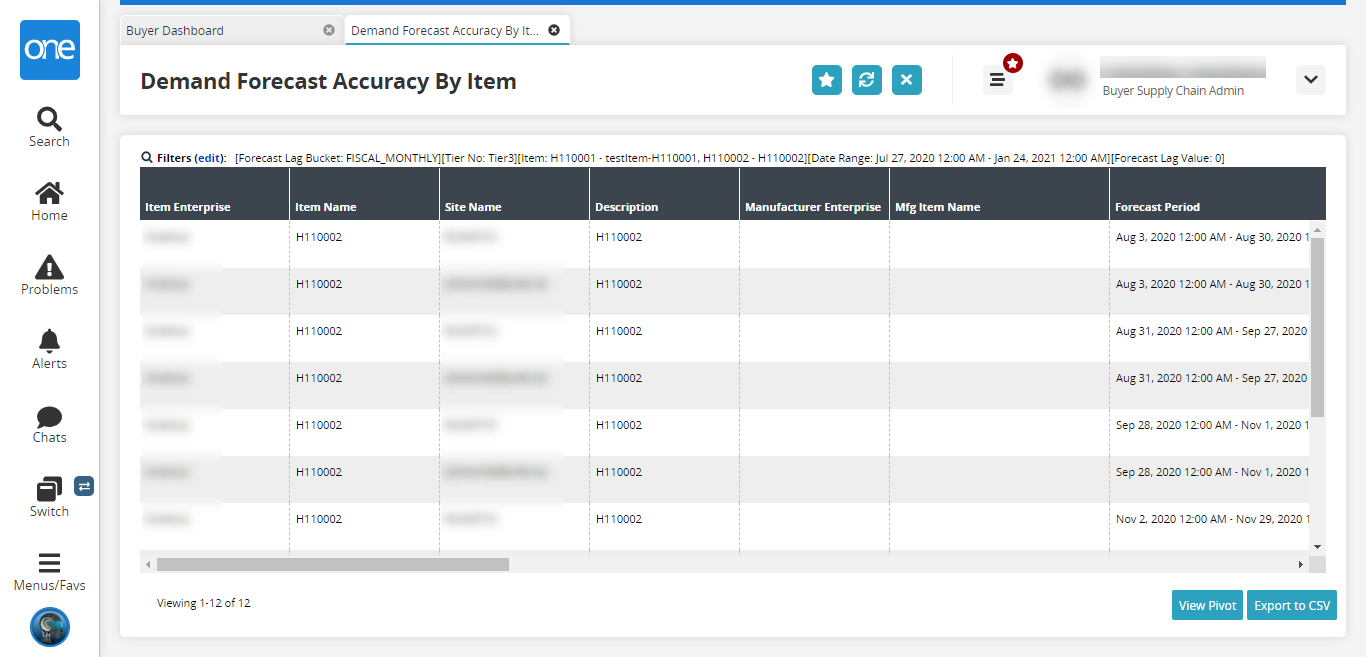
To view the results in a pivot chart, click the View Pivot button.
Click the Export to CSV button to export the report to a CSV file.