Viewing the Replenishment Analysis Projected Inventory View Mixed Bucketization
Complete the following steps to view the Replenishment Analysis Projected Inventory View Mixed Bucketization screen:
Log in to the ONE system in a Replenishment Planner role.
Click Menus/Favs > Analysis > Replenishment Analysis Projected Inventory View Mixed Bucketization.
The Replenishment Analysis Projected Inventory View Mixed Bucketization screen appears with the filters displayed.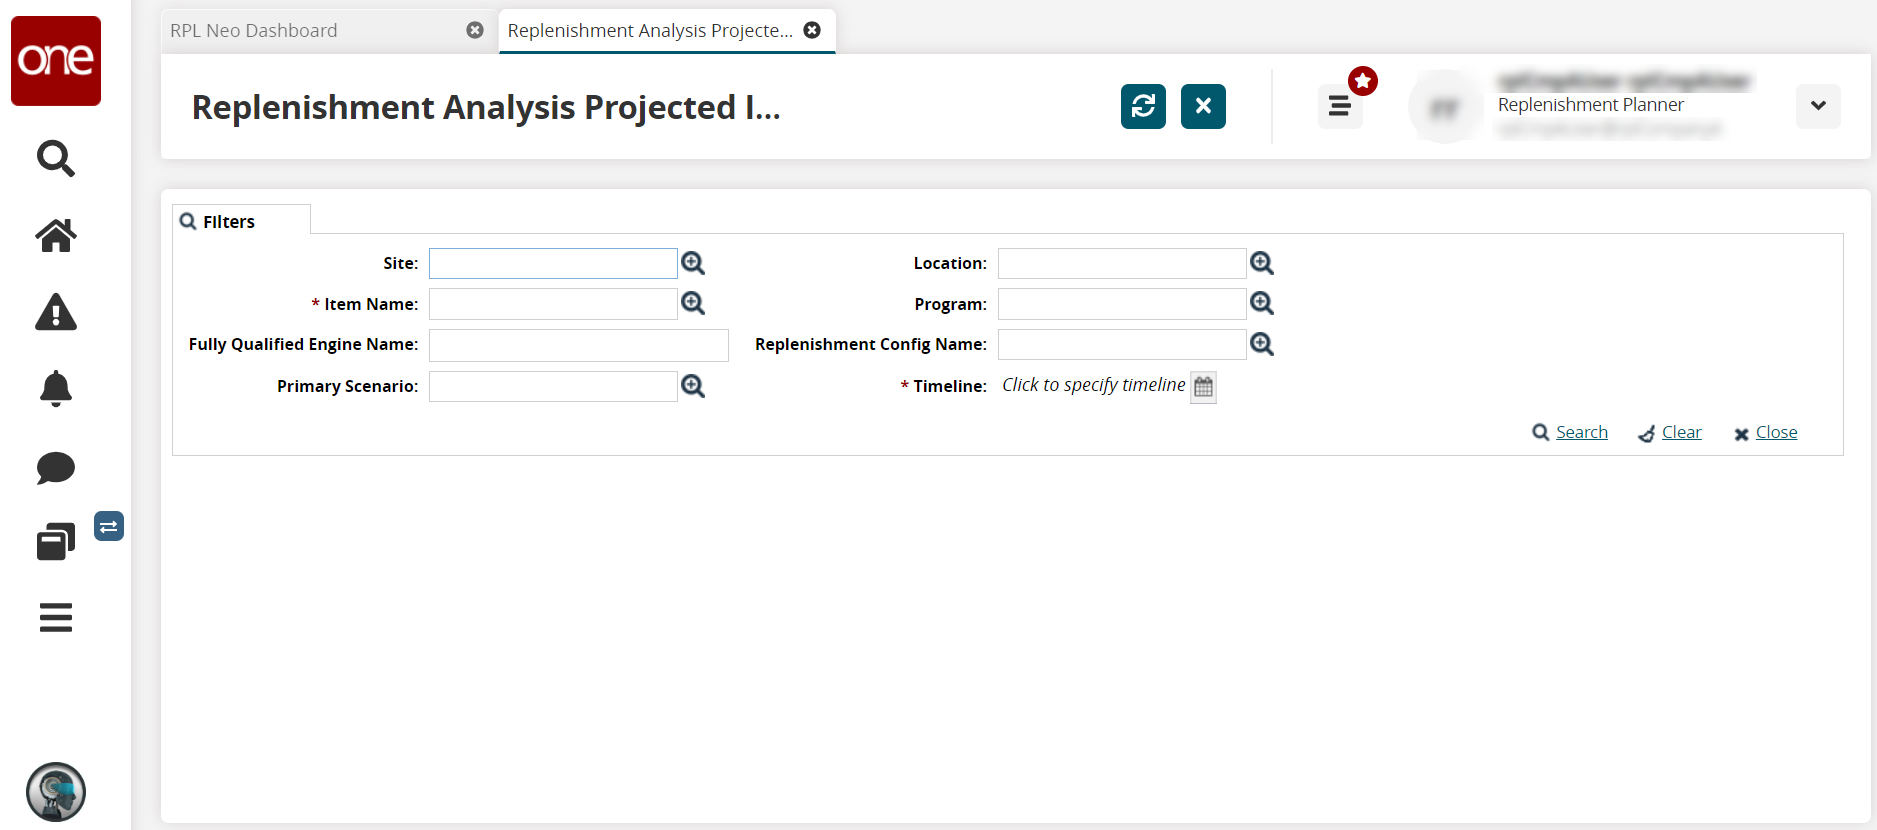
Fill out the following fields. Fields with an asterisk ( * ) are required.
Field Name
Description
Site
Begin typing the site name and select from the results that appear below the field, or use the picker tool to select it.
* Item Name
Begin typing the item name and select from the results that appear below the field, or use the picker tool to select it.
Fully Qualified Engine Name
Enter the engine name.
Primary Scenario
Begin typing the scenario name and select from the results that appear below the field, or use the picker tool to select it.
Location
Begin typing the location name and select from the results that appear below the field, or use the picker tool to select a location.
Program
Begin typing the program and select from the results that appear below the field, or use the picker tool to select a program.
Replenishment Config Name
Begin typing the configuration name and select from the results that appear below the field, or use the picker tool to select it.
* Timeline
Click the calendar icon.
A popup displays to select bucketization criteria. Fields with an asterisk ( * ) are required.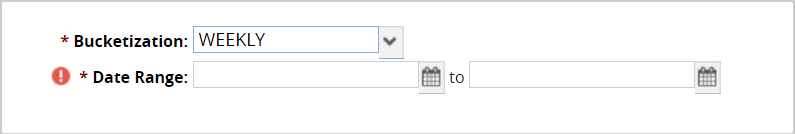
Select a time bucket from the * Bucketization dropdown list, and click the OK button. If you select Mixed, please see below.
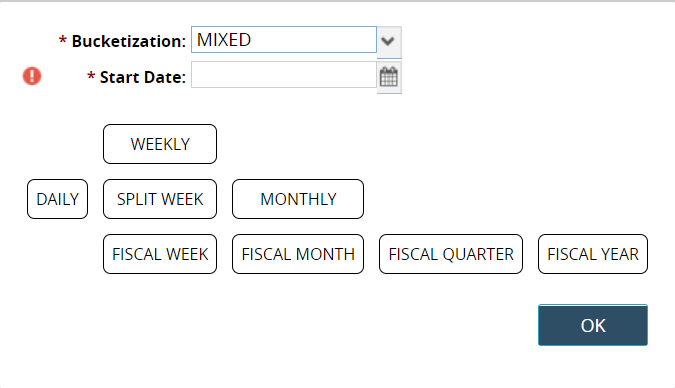
Click the calendar icon to select the * Start Date for the timeline.
Click one or two time buckets.
Time duration bars display.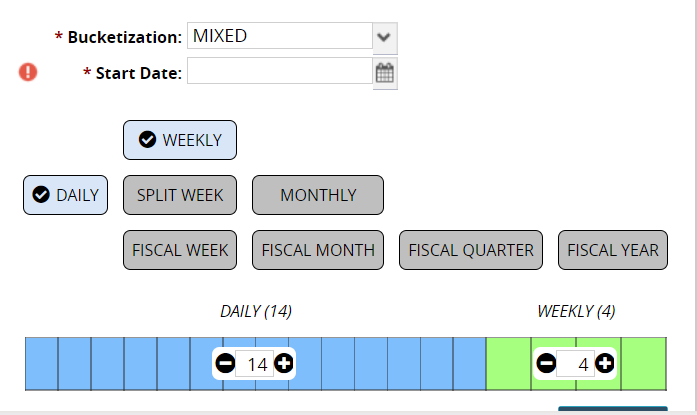
Click the minus and plus signs to increase or decrease the time buckets.
Click the OK button.
Click the Search link.
The Replenishment Analysis Projected Inventory View Mixed Bucketization screen appears.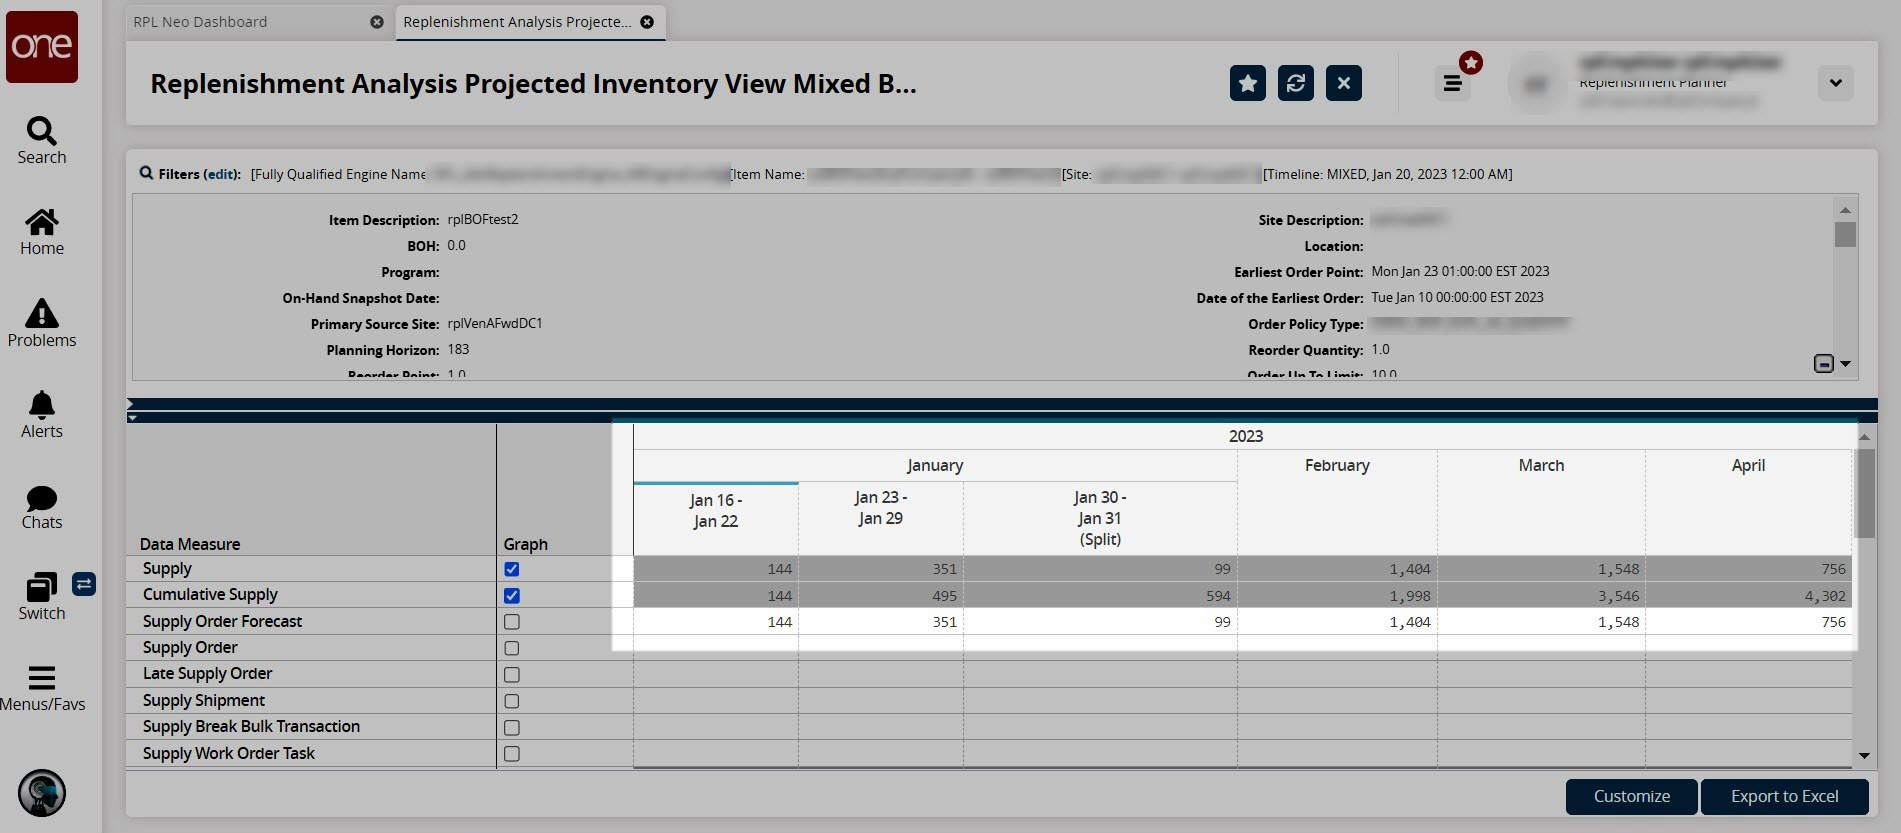
Click the collapse icon to collapse the details header.
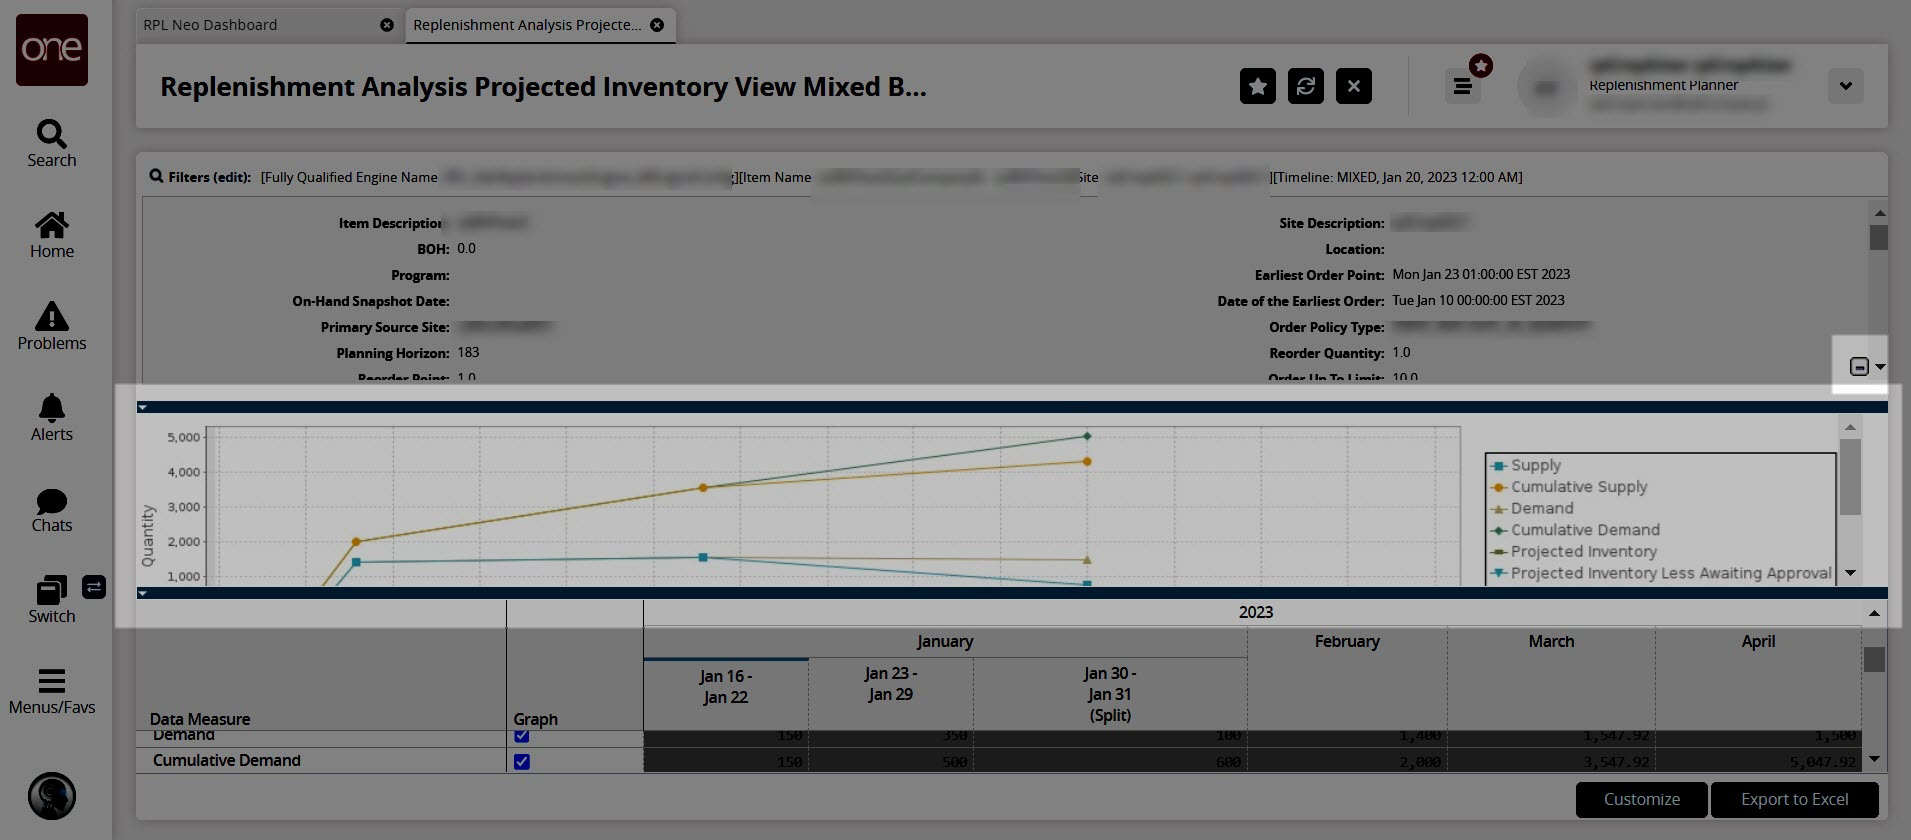
Click the expand arrow in the top header bar to show a graph.
Click a number link under any date column to view details for that data measure.
Detailed information for the selected data measure appears.Click Customize to customize the PIV for your specific organization or enterprise.
The Customization Level popup displays the options available to the user's role and permissions.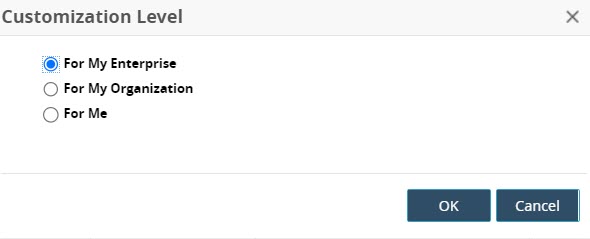
Select the customization level.
Click the OK button.
The screen displays the customization level with new customization options for each row.Click the eye icon to hide or unhide that data measure.
Click the plus sign for a data measure.
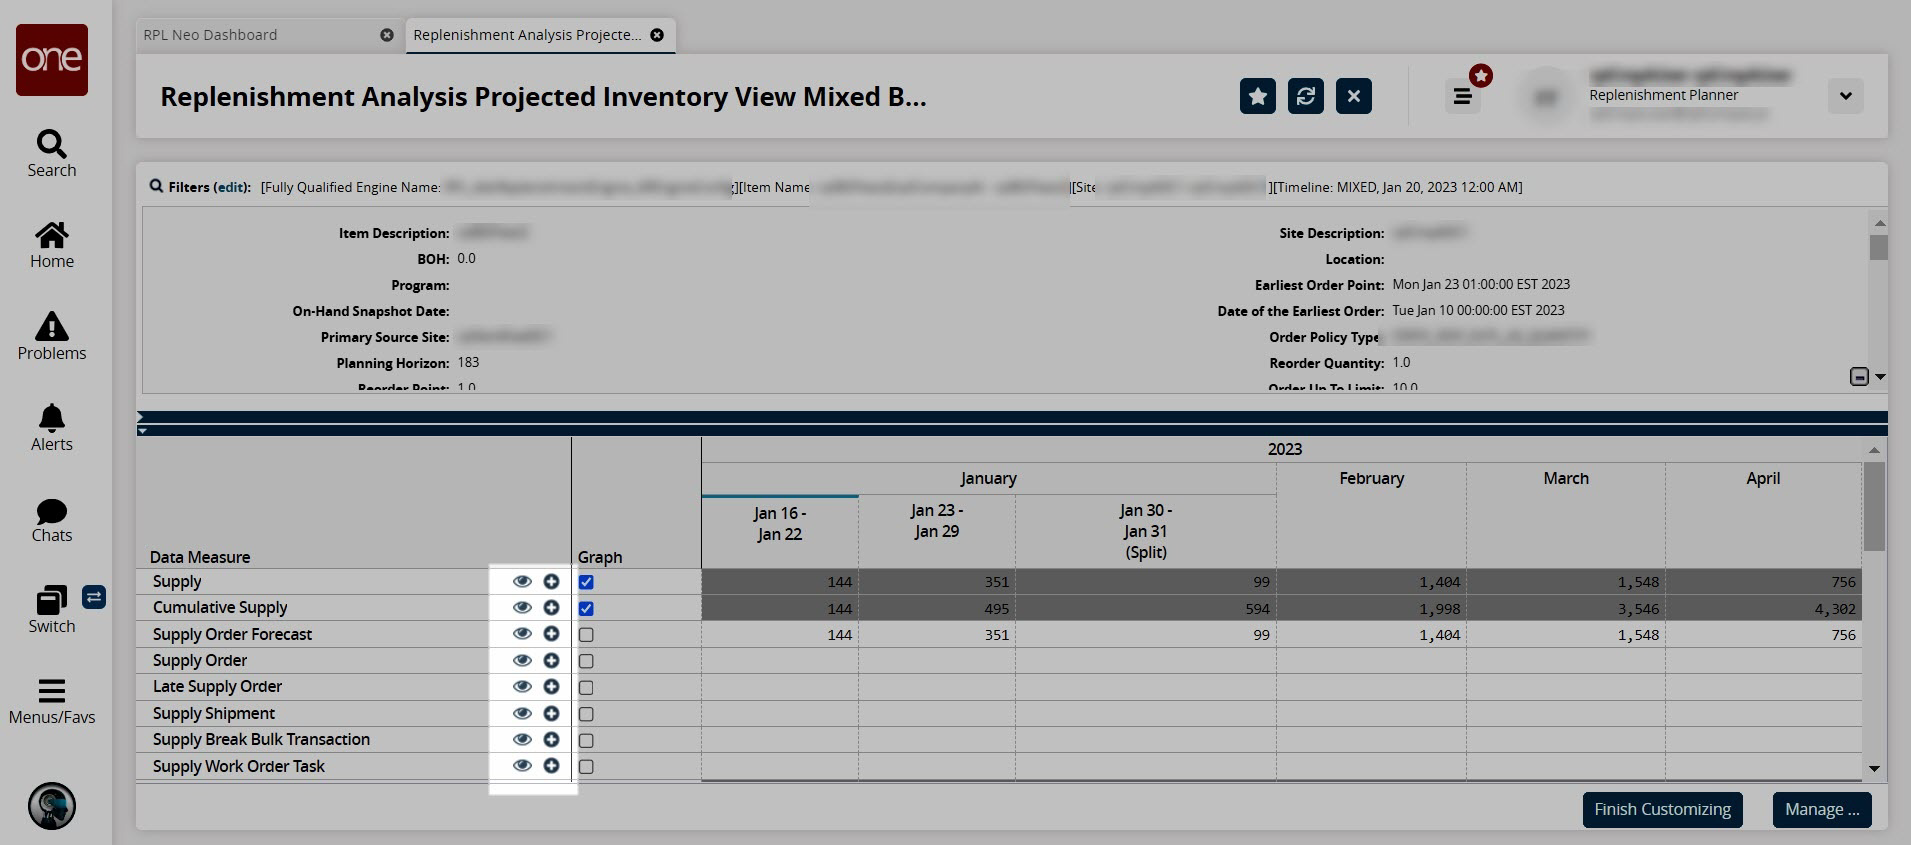
A menu displays options to Add Data Measure Above or Add Data Measure Below.Select an option.
The Add Data Measure popup displays.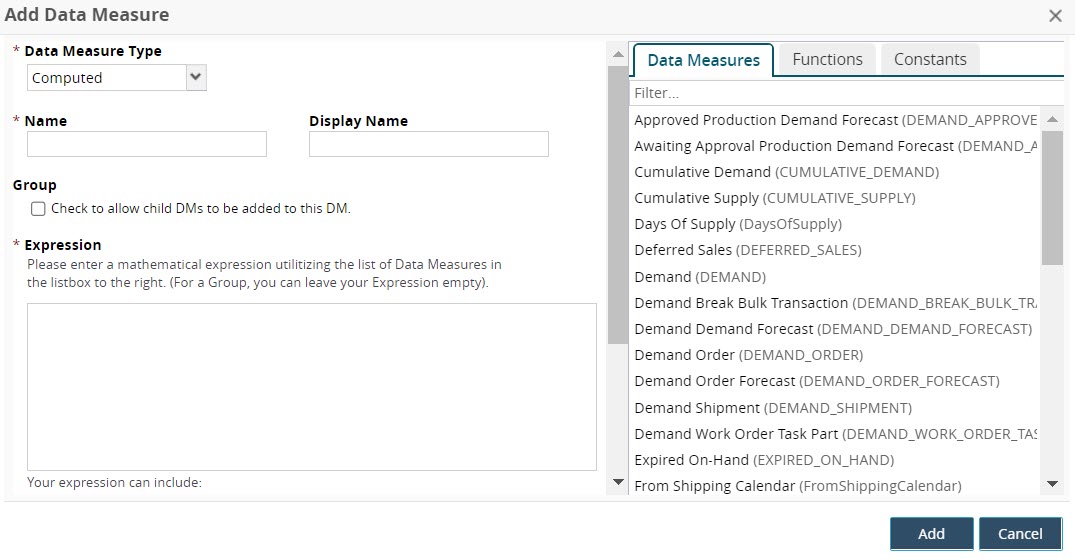
Enter values for fields described in the table below. Fields with an asterisk ( * ) are required.
Field
Description
* Data Measure Type
Select the data measure type from the dropdown list.
* Name
Enter a name for the data measure.
Display Name
Enter a display name if it should differ from the value in the Name field.
Group
Check the box to allow child data measures.
* Expression
Create an expression by typing it in or by clicking on the tabs (Data Measures, Functions, and Constants) and selecting the components.
General instructions display below this field:
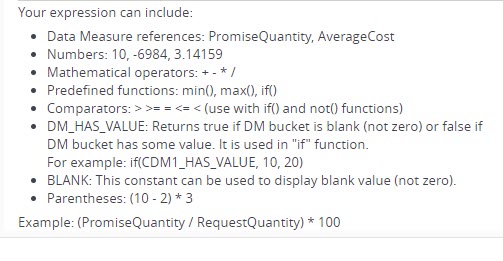
Specific instructions for the functions display as each is selected. Click the Insert link to add it to the Expression box.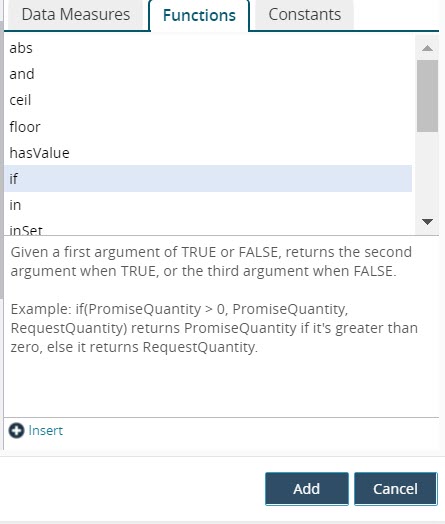
Click the Add button when finished identifying the data measure to be added.
Additional icons are displayed for deleting and editing the new data measure.Click the Manage button to view any existing customizations for timeline views.
Click the Finish Customizing button.
The screen reflects the changes.Click the left and right arrows at the bottom of the screen to move the PIV forward in the timeline (ex: to view the next month out).
Click Export to Excel to export the results to a spreadsheet.