Configuring the Remote Debugger in Studio
To use this feature, you must first start your server using the Ant target titled run-server-jdwp. This starts the server with JDWP enabled.
Do not run production servers with JDWP enabled as this would present a serious security risk as well as hamper performance.
Once the server has finished start-up, switch to Studio and configure the debugger to attach to the server.
Procedure 3.18. To configure the debugger to attach to the server:
Select Run | Debug Configurations.
Find the entry for Remote Java Application. Right-click it and click New.
Figure 3.36. Remote debugger configuration.
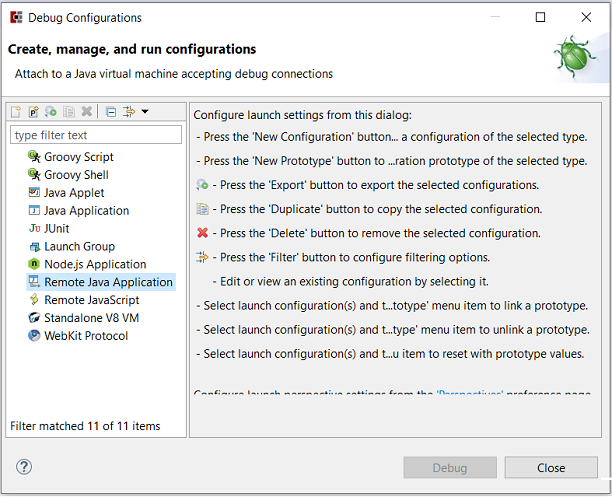
The ensuing dialog will display the configuration screen for the new debugger. The default settings will be based on whatever file you happen to have open. The first box, name, is completely arbitrary and generally takes on the name of the file you currently have open. You can change it if you wish. The important settings are those that remain. You must select the project you want to debug. This selection should be pre-populated with the current project. The rest of the settings should remain on their defaults except for the port. Change the port to 8787.
Figure 3.37. Remote debugger listens on port 8787.
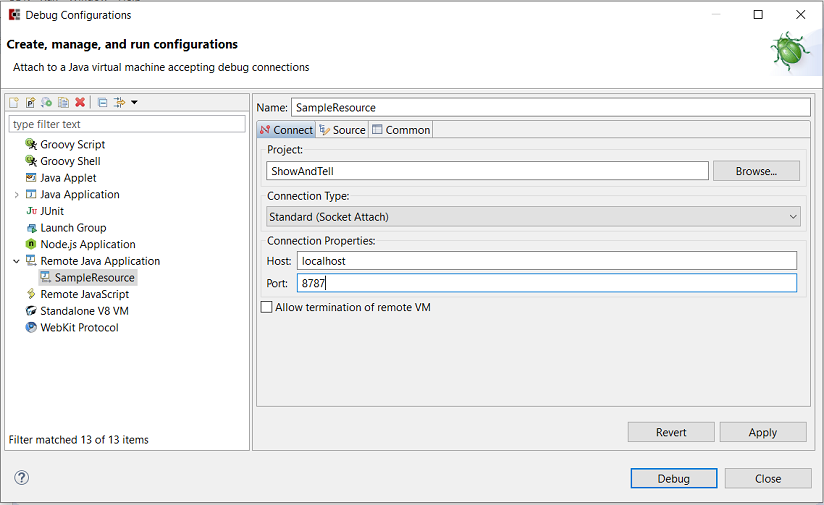
Click the Apply button.
Click the Debug button. You will be prompted to open the Debug perspective in Studio. Do so.