Debugging Performance Issues
Knowing how to architect and write queries to try and avoid performance issues is only part of the battle. The other half is detecting and correcting existing performance issues.
PSR Logger
Platform provides a poor man’s code profile in the form of PSR Logger. With the PSR Logger you add the instrumentation for the profiling to your own source code. The preferred practice is try and use the rule of 3 – you place the instrumentation to about 3 levels deep in your code.
Your engine might be Read, Process and Write. Read reads Orders and Shipments. Order has a function for processing each order. So the PSR could be set at the Read, Read Order, and Prepocess Order steps for 3 levels of depth.
The instrumentation looks like this…
try (PSRLoggerEntry ple = new PSRLoggerEntry(engine-name, this, function-name)) {
//place rest of function code here
}
Platform then maintains a PSR cache of these entries measuring when this area of the code is entered and left, time spent, number of times called.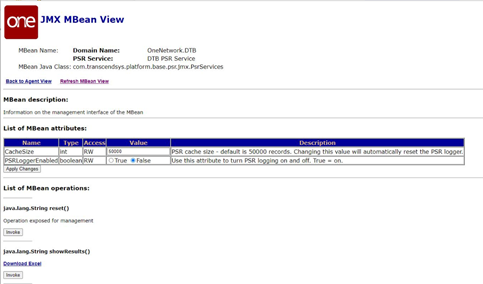
Platform exposes this on JMX console.
PSR Service=DTB PSR Service under the OneNetwork.DTB section.
PSR Service has PSRLoggerEnabled where user can set to True or False. Set this to True and click Apply Changes to start logging.
NOTE: Similar to regular log levels – this turns PSR on only for the node you log into with JMX Console.
PSR Service has a Reset. Click this to reset the logs. It is recommended to click Reset before any test.
PSR Service has showResults() this has an Invoke that will return an HTML page of crudely formatted data meant to be cut and pasted into Excel. You can get the same data by clicking the Download Excel link.
The results are in the form of an excel file. Each row represents a method call (a method that was instrumented). Each method is placed under the method that called it. The depth column tells you how many (instrumented) methods deep the call is. Calls is the number of times it was called since the log was started/reset. The avg (s) is the average amount of time spent in the method (including any of the methods this method calls. The Min and Max and Total times are similar to Average except the obvious math. The CPU times are different. I’m not confident on how this measurement differs. Total CPU is the time I actually use the most as it is the total time spent by the application conducting that process.
If you see the attached PSRRestults. This is real example where you can see Platform’s Polling methods (Grid Job and Tasks). Here you can see Poll and Enque calls Delete, Insert, Update and DVCE_CACHE_SYNC. The Insert is made up of Read By Keys for Grid Job and Read By Keys for Grid Tasks. Read by Keys for Grid Tasks is further broken down by Read for Grid Tasks Row. The numbers don’t mean a lot because I basically click reset and the clicked results. But the point should be clear.
What is normal?
It is normal is see about 30% of time reading data. 10% time processing data. And up to 60% writing data. The read times can increase if the amount of data read (2 years of history) is smaller than the amount of data written (6 weeks of forecast). This can swing up to 45%, 10%, 45%. If read time is longer then we should look at how the reads are structured including query performance, indexes, etc… If the processing time exceeds 10% then we need to look at normal JAVA coding type issues like nested For loops, etc.. If the write is taking too long then we need to look for database contention, poorly formed writes, call backs, etc..
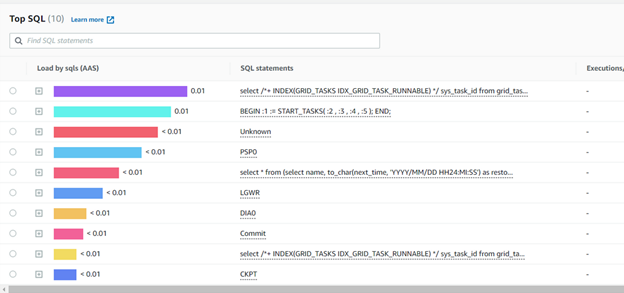
Long Running Queries
One of the most common questions asked with a performance problem is for the long running queries. This can be gathered from several places. Oracle’s Enterprise Manager (OEM) is good source but not be available for your instance. There’s some free tools. But you can even learn to write the query
Explain Plans
Explain Plans have been discussed in great detail earlier in this document. But given the long running queries this is generally the next step to diagnose the issue.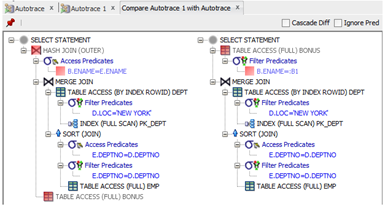
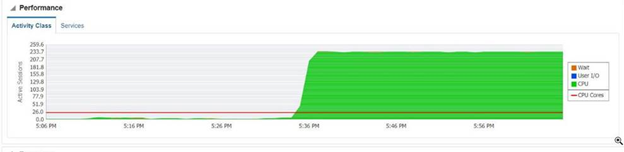
Database CPU Utilization and Performance
Oracle Enterprise Manager (OEM) can also identify how much processor is being used. If CPU utilization is out of control then it may not be the query in the engine but rather the engine is the victim. It’s important to review what else is occurring at the time of the incident.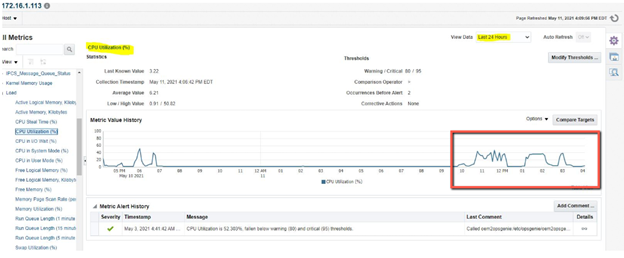
In addition to the CPU Utilization, Oracle can present the amount of CPU utilization along with how much is spent on various factors such as I/O and contention (wait). Much of this information is valuable to a DBA. But from development, the contention can be caused by poor engine architecture such as deleting transactional data from multiple concurrent threads.