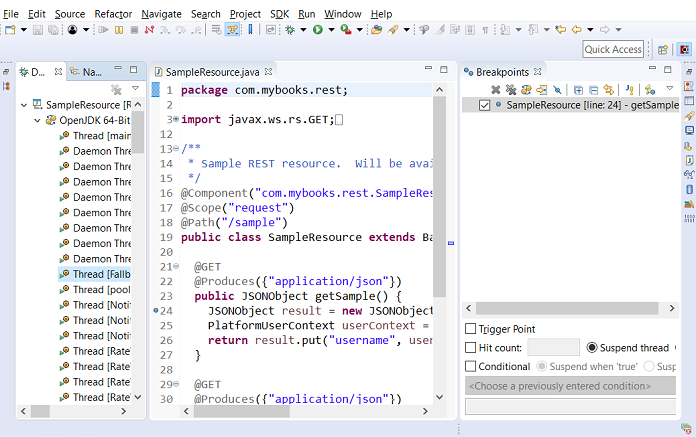
The Debug Perspective
The Debug perspective shows you three panes. The top-left pane displays all the running threads in the current server session. The top-right pane shows you a list of all breakpoints in your project as well as a watch window where you can view and change the value of currently in-scope variables and objects.
The middle pane shows the code at the current breakpoint.
Figure 3.39. The Debug Perspective