Using Oracle's EXPLAIN Profiler
The SQL Editor window gives you access to Oracle's profiling capabilities which allow you to benchmark your complex SQL queries and locate bottlenecks. To use the EXPLAIN profiler, simply click the Explain Plan button on the SQL Editor's toolbar.
Figure 3.27. The Explain Plan button shows a performance analysis of your query.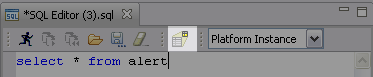
A tab appears with the results which break down each step of the query's execution along with how long each step took.