Aggregated Demand Forecast Accuracy Report
The Aggregated Demand Forecast Accuracy allows users to see forecast accuracy data aggregated by different levels, such as at the product group level, site group level, or partner level. This report displays the performance of each of the six forecast strategies (statistical, business development, sales, product planning, operations, and consensus) expressed as Mean Absolute Percentage Error (MAPE ). Users can analyze across any time horizon window and display data in dollars or in units of measure (UOMs).
Complete the following steps to use the Aggregated Demand Forecast Accuracy report:
L og in to the ONE system.
Click Menus/Favs > Demand Planning > Forecast Accuracy > Forecast Accuracy by Site > Aggregated Demand Forecast Accuracy. In the NEO UI, users can click on the Menus/Favs icon on the left sidebar and type in the name of the screen in the menu search bar. For more information, see "Using the Menu Search Bar."
The Aggregated Demand Forecast Accuracy screen displays the Filters header.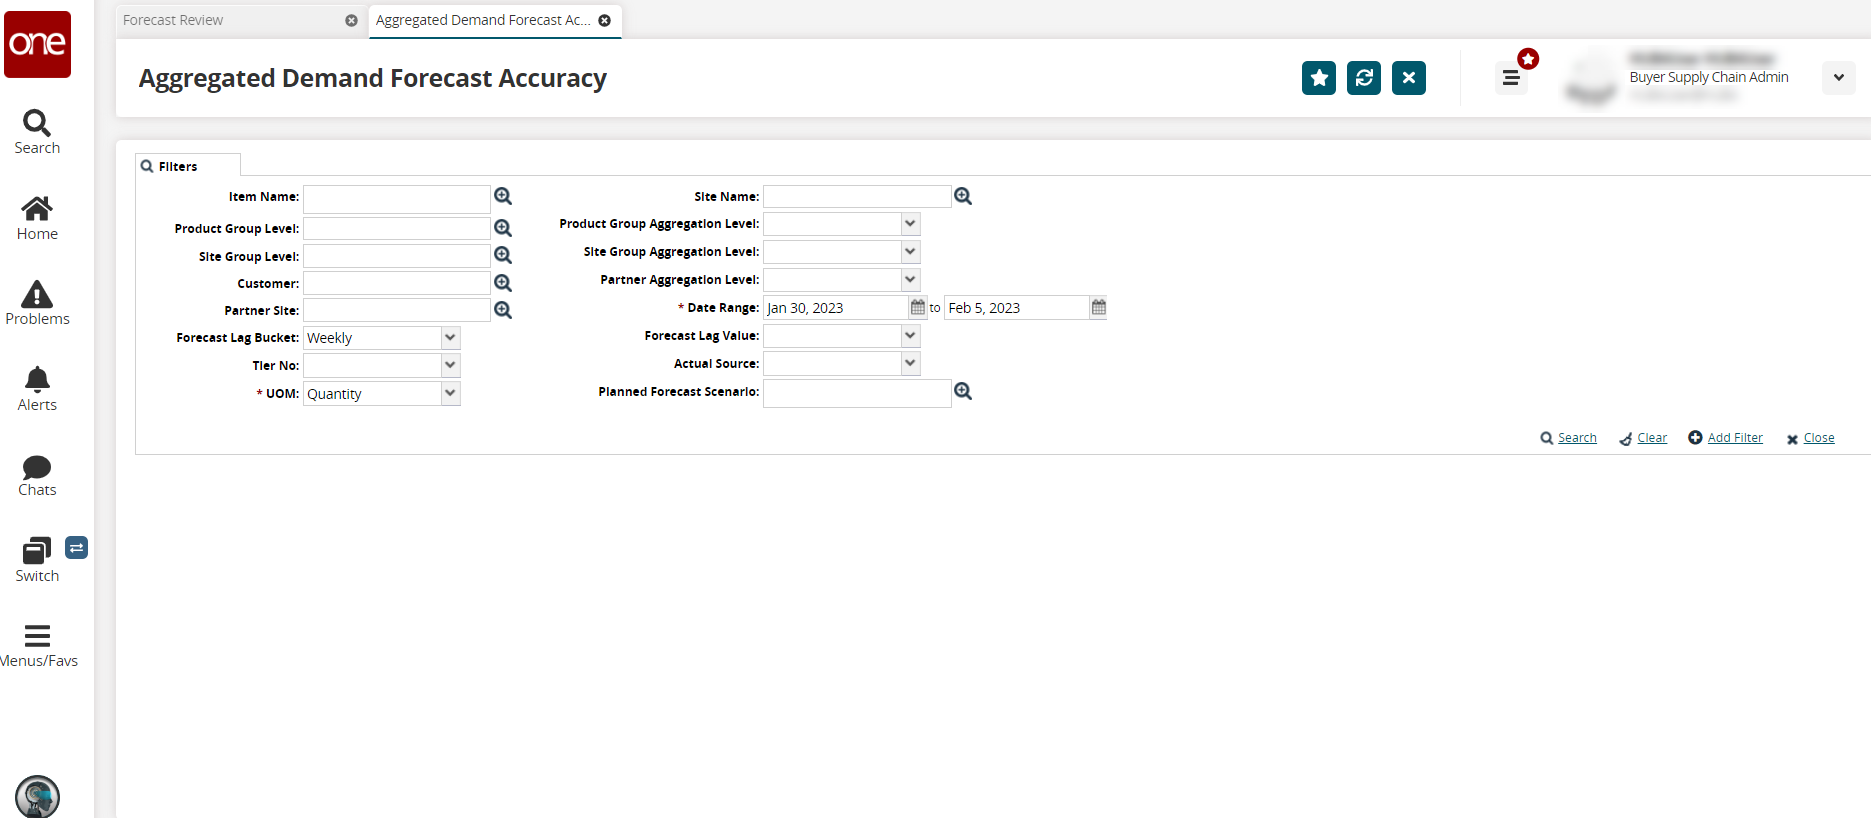
Enter values for fields described in the table below. Fields with an asterisk ( * ) are required.
Field
Description
Item Name
Enter or use the picker tool to select the item name.
Product Group Level
Enter or use the picker tool to select the product group level.
Site Group Level
Enter or use the picker tool to select the site group level.
Customer
Enter or use the picker tool to select the customer.
Partner Site
Enter or use the picker tool to select the partner site.
Forecast Lag Bucket
Select the forecast lag time bucket from the dropdown list.
Tier No
Select the tier number from the dropdown list.
* UOM
Select the unit of measure from the dropdown list.
Site Name
Enter or use the picker tool to select the site name.
Product Group Aggregation Level
Select the product group aggregation level from the dropdown list.
Site Group Aggregation Level
Select the site group aggregation level from the dropdown list.
Partner Aggregation Level
Select the partner aggregation level from the dropdown list.
* Date Range
Use the calendar tools to select the beginning and end dates for the forecast.
Forecast Lag Value
Select the forecast lag value from the dropdown list.
Actual Source
Select the source from the dropdown list.
Planned Forecast Scenario
Enter or use the picker tool to select the planned forecast scenario.
Click the Search link.
The data results display.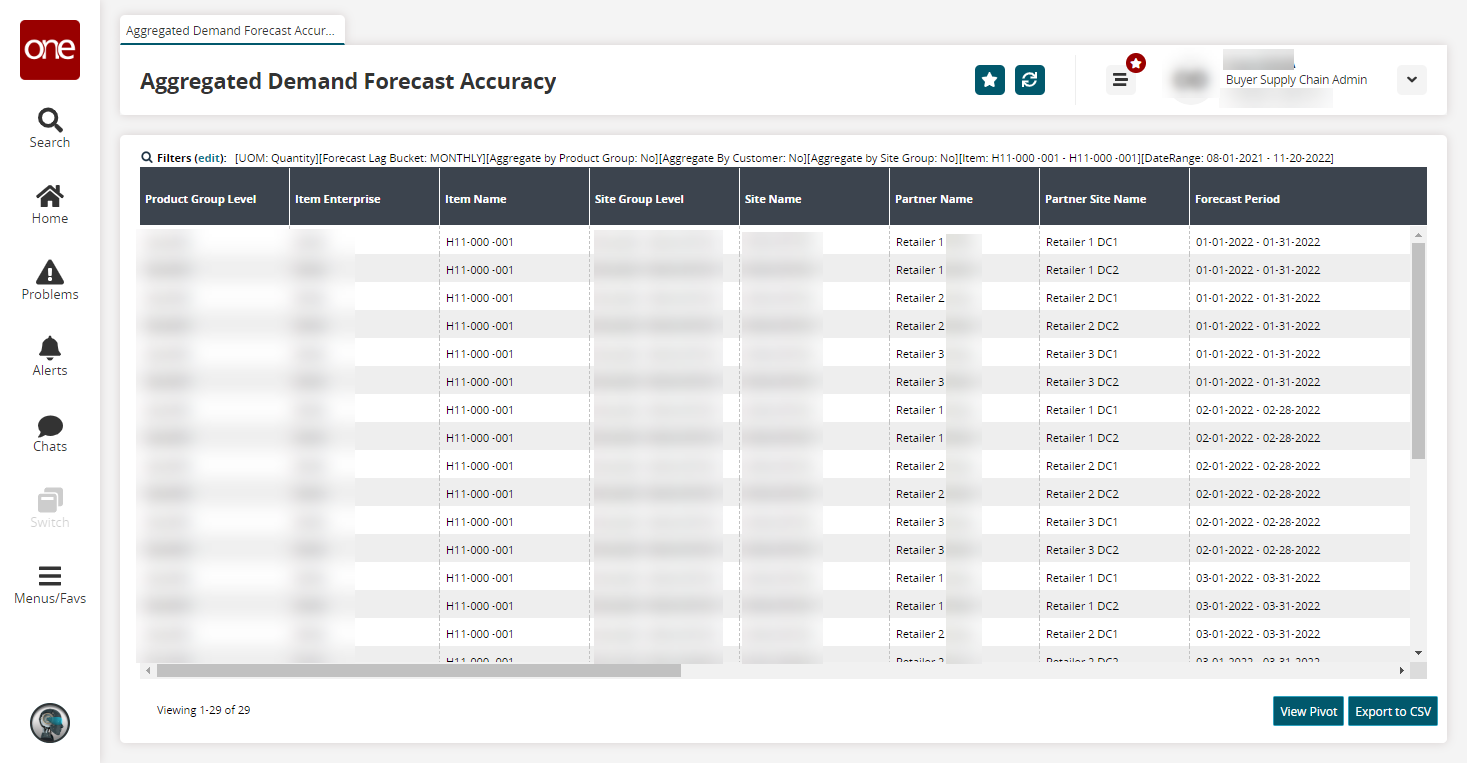
Click the View Pivot button to view the data in a pivot table.
Click the Export to CSV button to export the report to a CSV file.