Analyzing Historical Similarity
There are multiple options for working with Historical Similarity available in the system. These options allow demand planning users to create more accurate order forecasts.
Analyzing Item Similarity by Store Profiles
Complete the following steps to analyze similarity by store profiles:
Log in to the ONE system.
Click Menus/Favs > Demand Planning > Life Cycle Forecasting > Item Life Cycle Forecasting > Analyze Item Similarity By Store Profiles.
The Analyze Similarity By Store Profiles screen appears.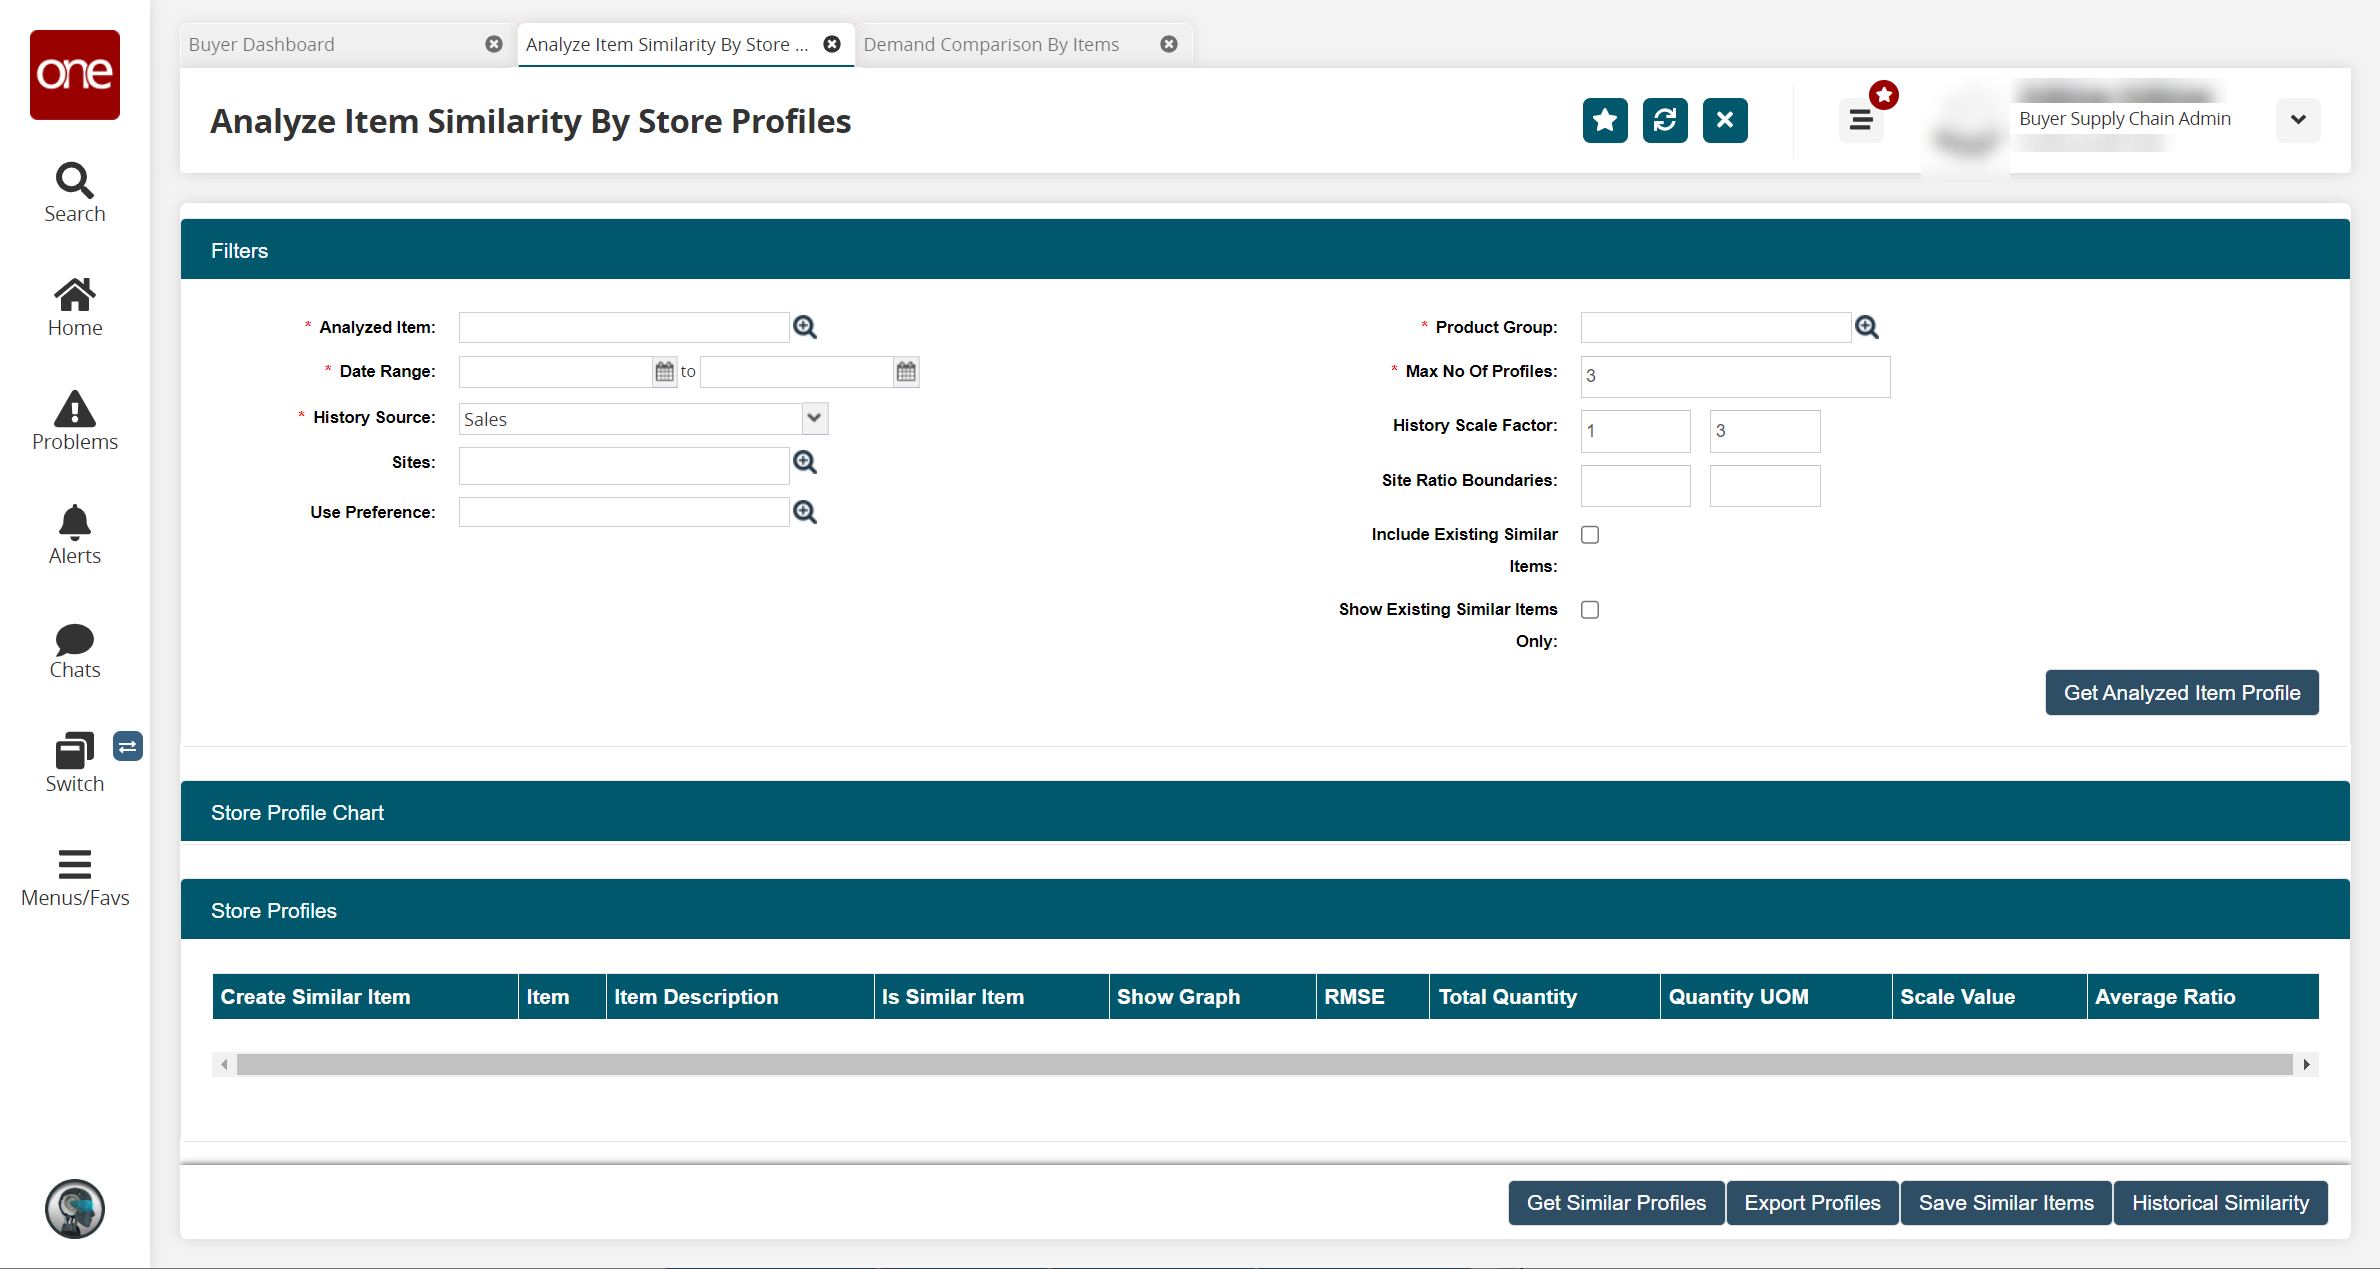
Fill out the following fields. Fields with an asterisk ( * ) are required.
Field
Description
* Analyzed Item
Click the picker tool icon to select the item to be analyzed.
* Date Range
Click the calendar icons to select the date range for the analysis.
* History Source
Select the history source from the dropdown list.
Sites
Click the picker tool icon to select the sites for the analysis.
Use Preference
Click the picker tool icon to select the use preference.
Product Group
Click the picker tool icon to select the product group.
Max No Of Profiles
Enter a numerical value for the maximum number of profiles.
History Scale Factor
Enter numerical values for the history scale factor.
Site Ratio Boundaries
Enter numerical values for the site ratio boundaries.
Include Existing Similar Items
Select the checkbox to include existing similar items.
Show Existing Similar Items Only
Select the checkbox to show existing similar items only.
Click the Get Analyzed Item Profile button.
A success message appears, and a list appears under the Store Profiles heading.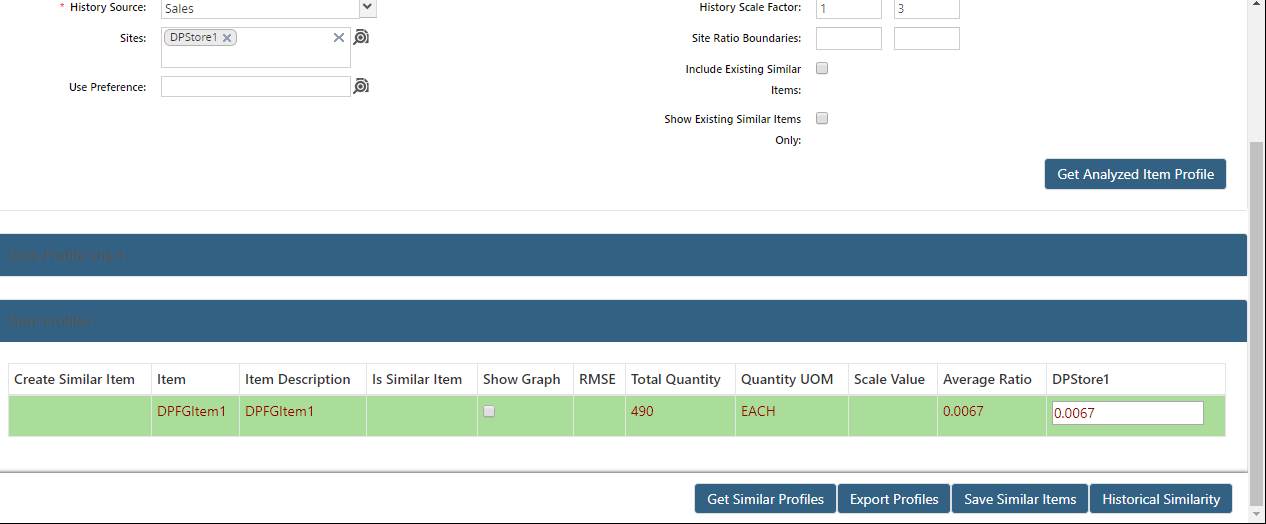
To get a list of similar profiles, click the Get Similar Profiles button at the bottom of the page.
If similar profiles are not available, the system displays an error message.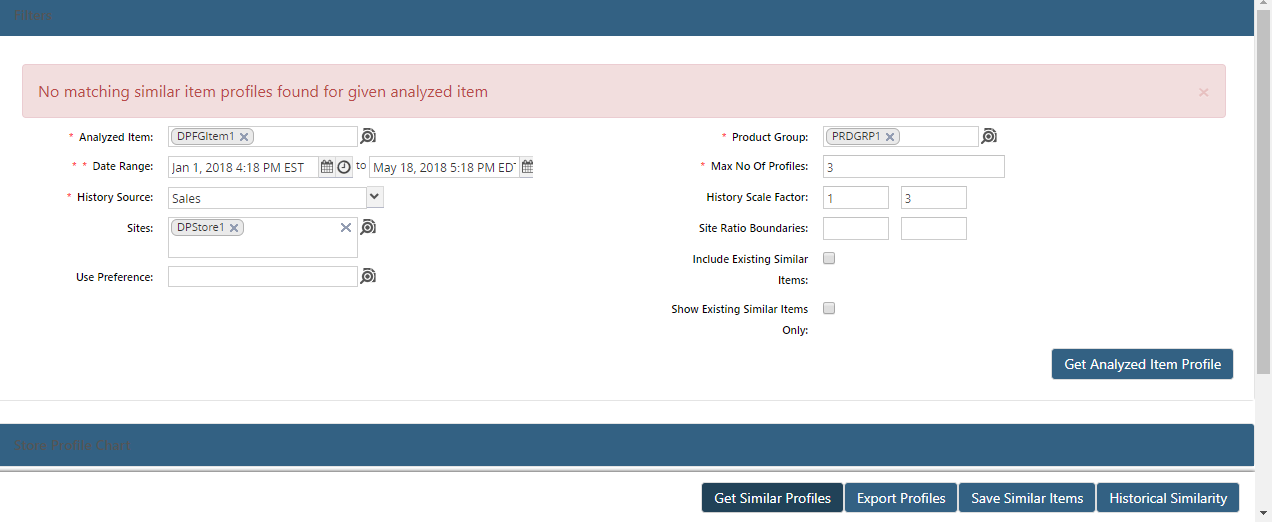
To export profiles to a CSV file, click the Export Profiles button.
To save similar items, click the Save Similar Items button.
To view historical similarity related to the query, click the Historical Similarity button.
Similarity information appears on a new tab.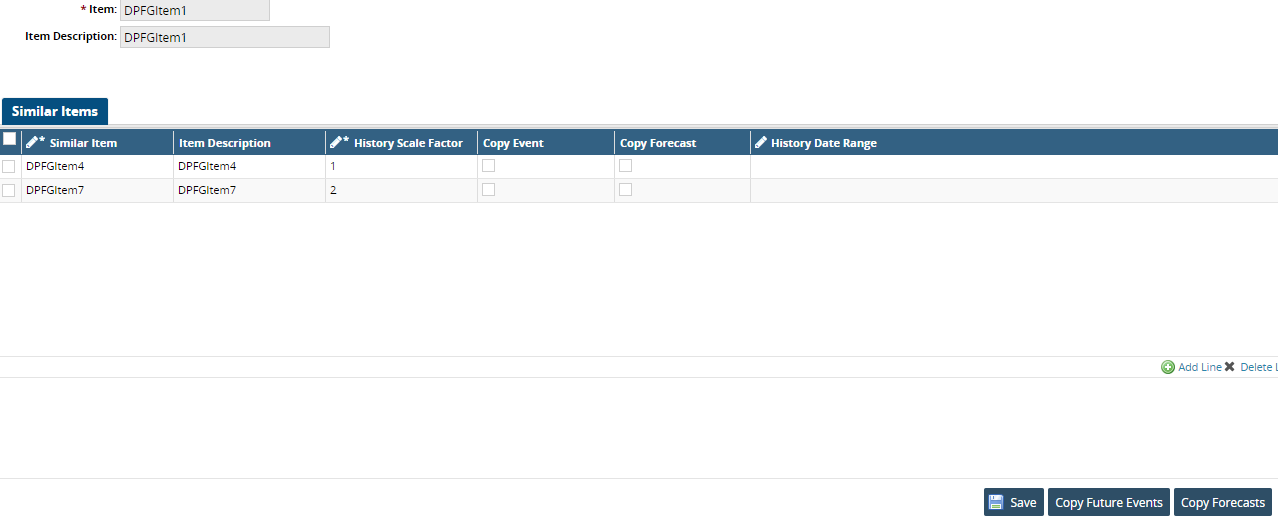
Note
For more information about similar items, see the Search Similarity Settings section of the Online Help.
Comparing Demand History By Items
Complete the following steps to compare demand between items:
Log in to the ONE system.
Click Menus/Favs > Demand Planning > Demand Comparison By Items.
The Demand Comparison By Items screen opens.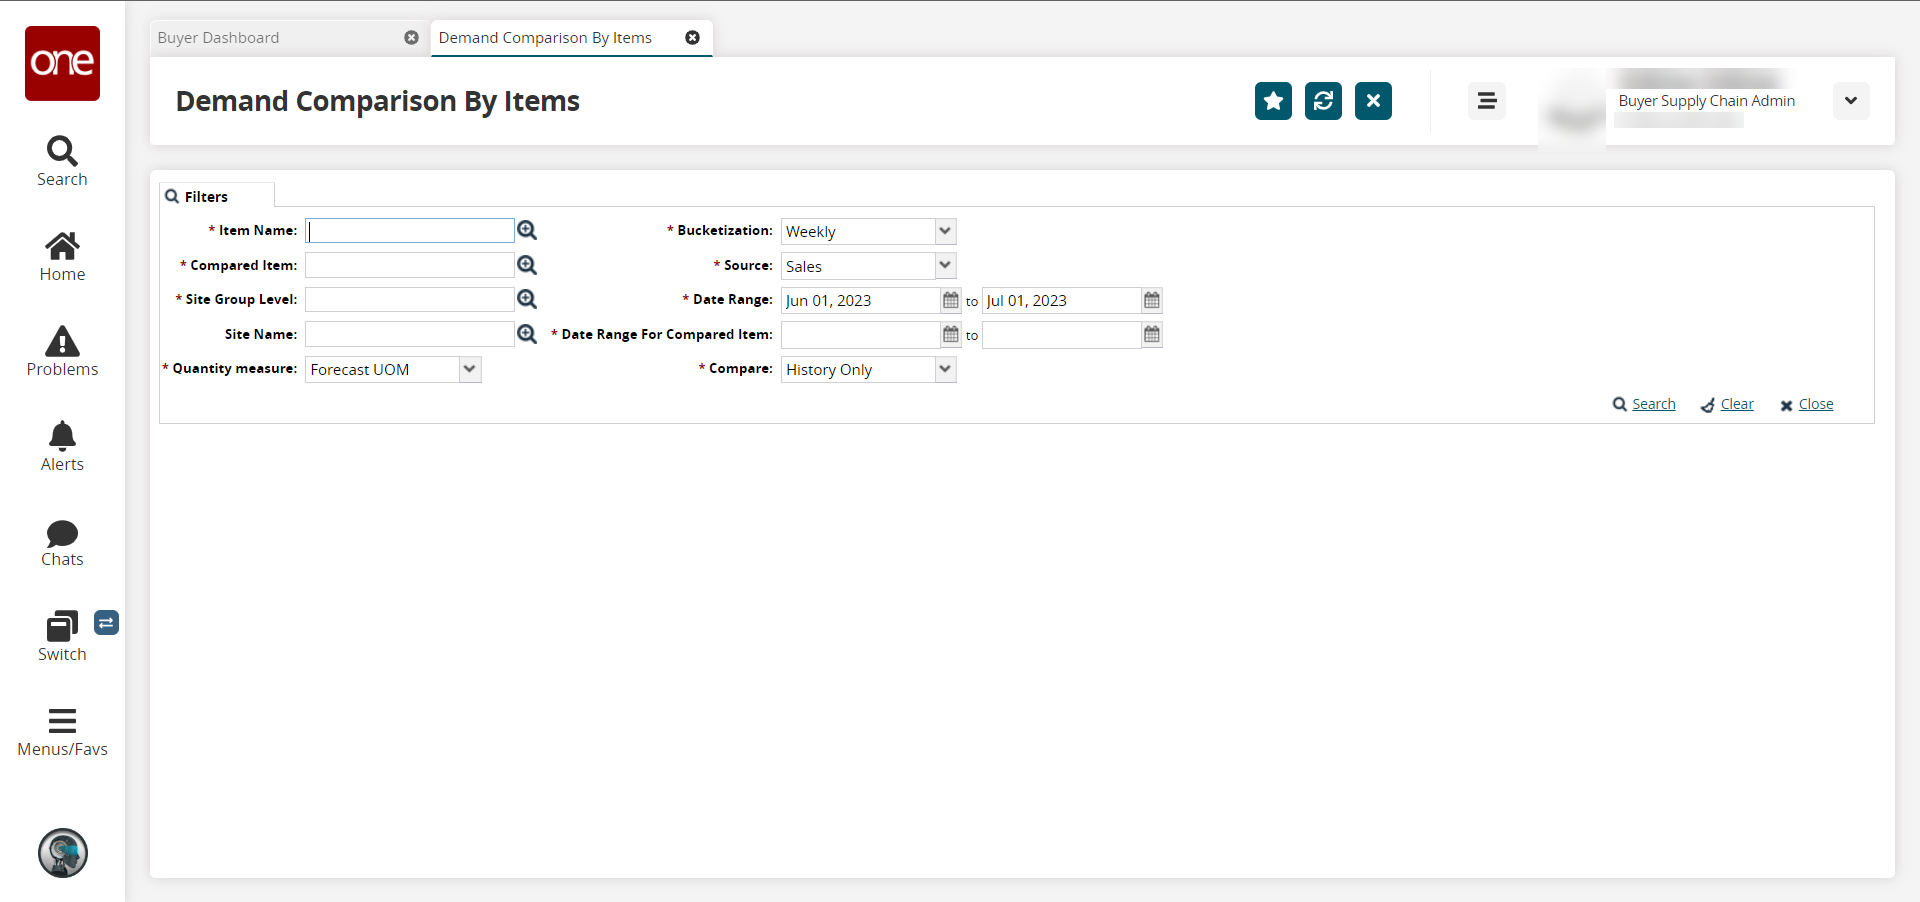
Fill out the following fields. Fields with an asterisk ( * ) are required.
Field
Description
* Item Name
Click the picker tool icon to select the item.
* Compared Item
Click the picker tool icon to select the compared item.
* Site Group Level
Click the picker tool icon to select the site group level.
Site Name
Click the picker tool icon to select the site.
* Quantity measure
Select the quantity measure from the dropdown list.
* Bucketization
Select the bucketization period from the dropdown list.
* Source
Select the source from the dropdown list.
* Date Range
Click the calendar icons to select the date range.
* Date Range For Compared Item
Click the calendar icons to select the date range for the compared item.
* Compare
Use the dropdown list to select whether to compare History Only, Forecast Only, or History and Forecast.
Click the Search link.
Comparison information appears.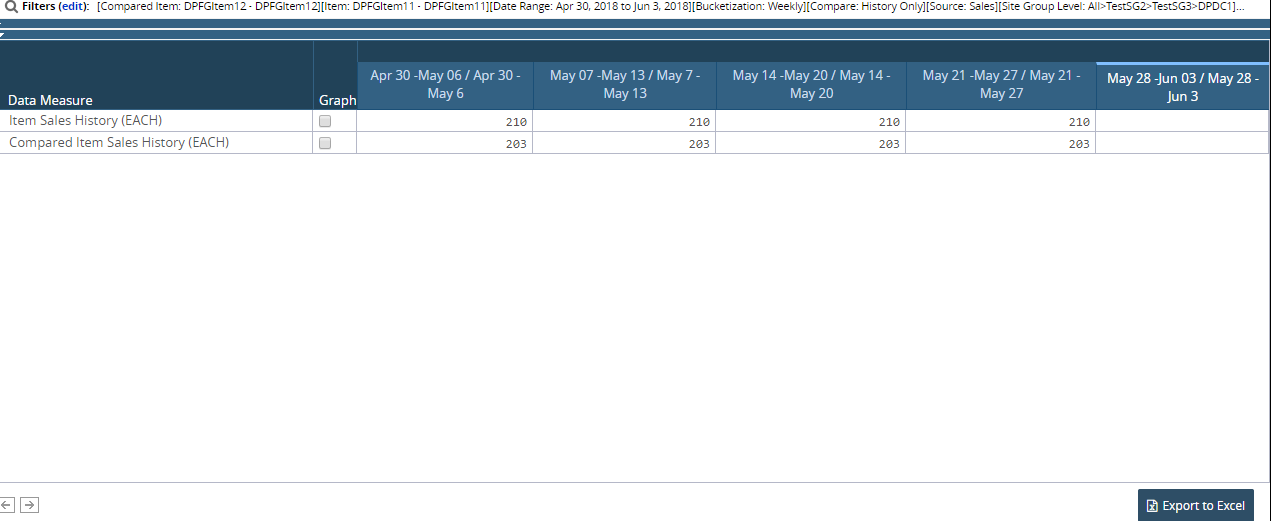
The data measures can be visually represented on a graph. Click the checkboxes in the Graph column to load the data points on a graph above the TLV.
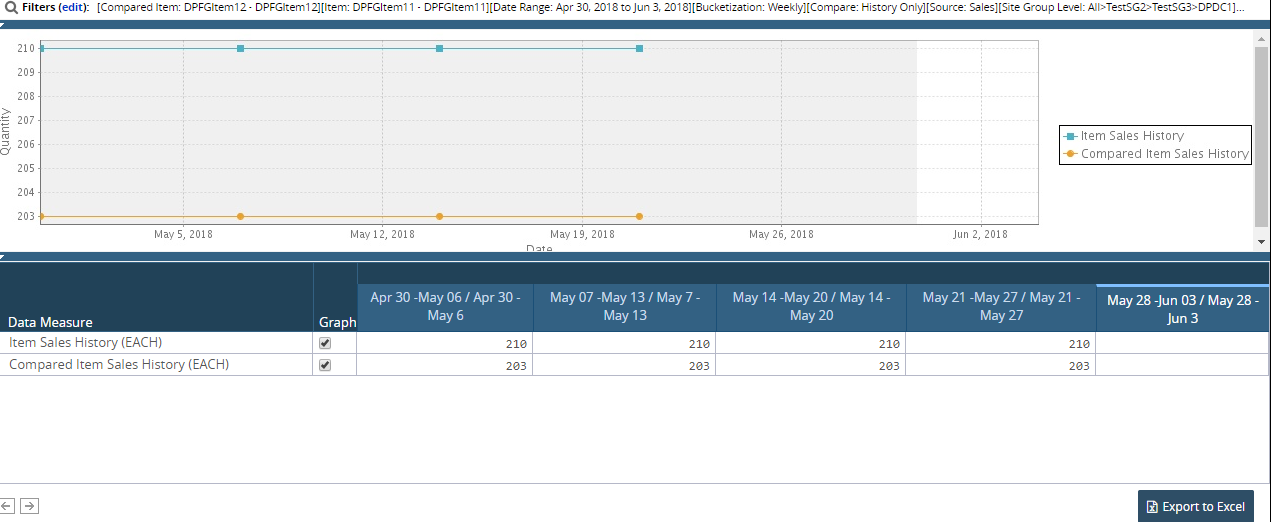
To export the results to a spreadsheet, click the Export to Excel button at the bottom of the screen.