KPI Metrics
You can quickly view bar chart or line chart graphs of various KPI metrics, including but not limited to:
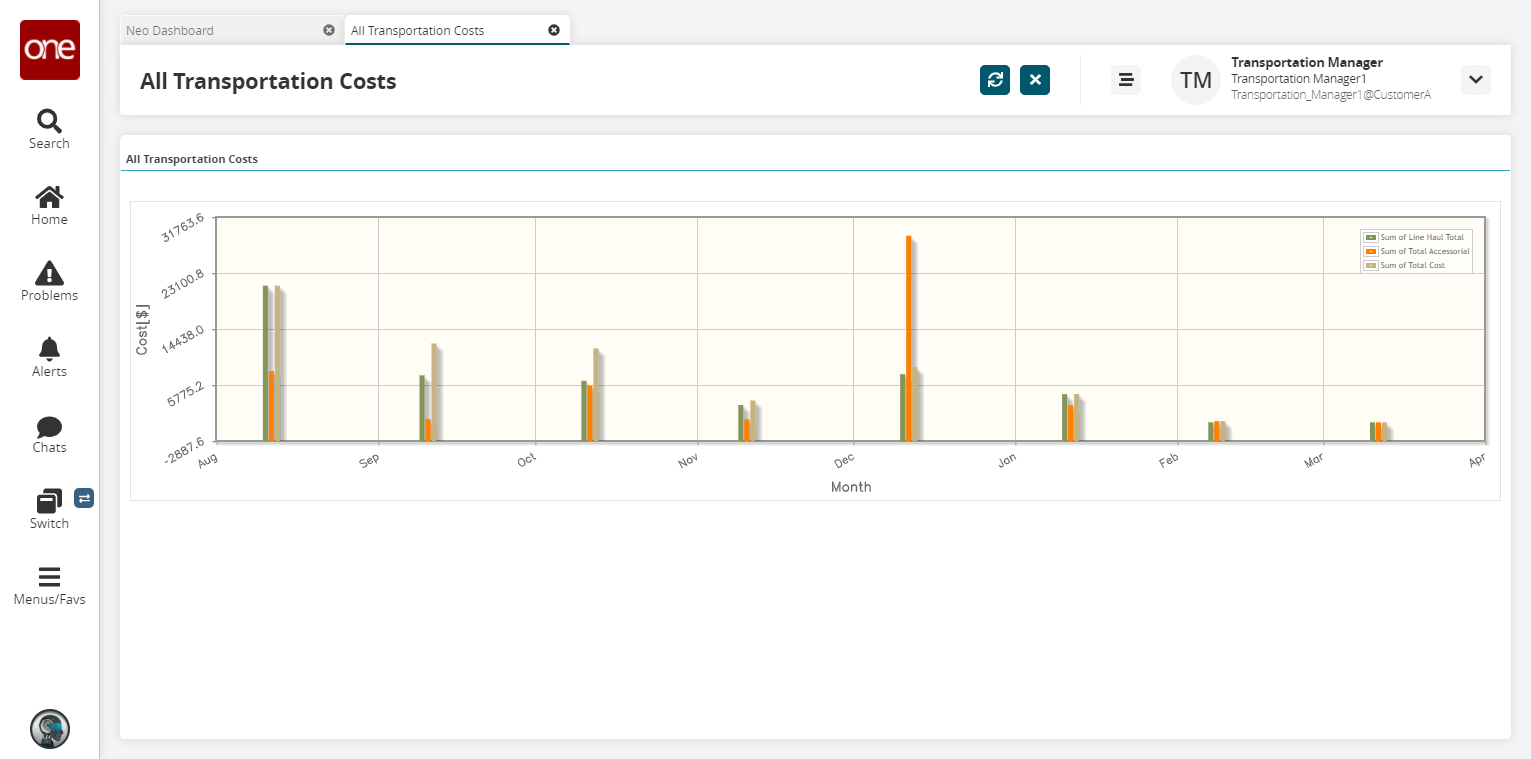
All Transportation Costs
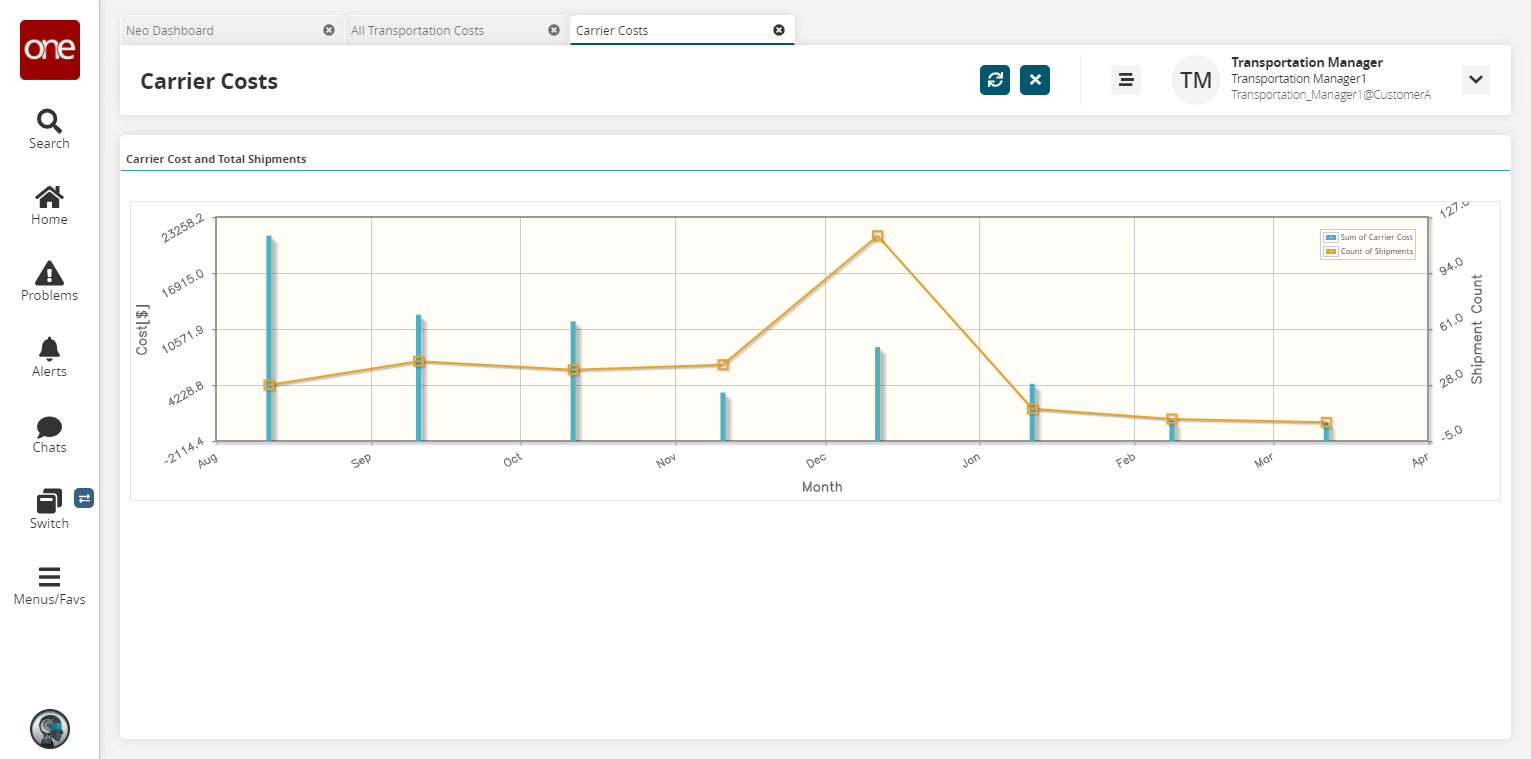
Carrier Costs
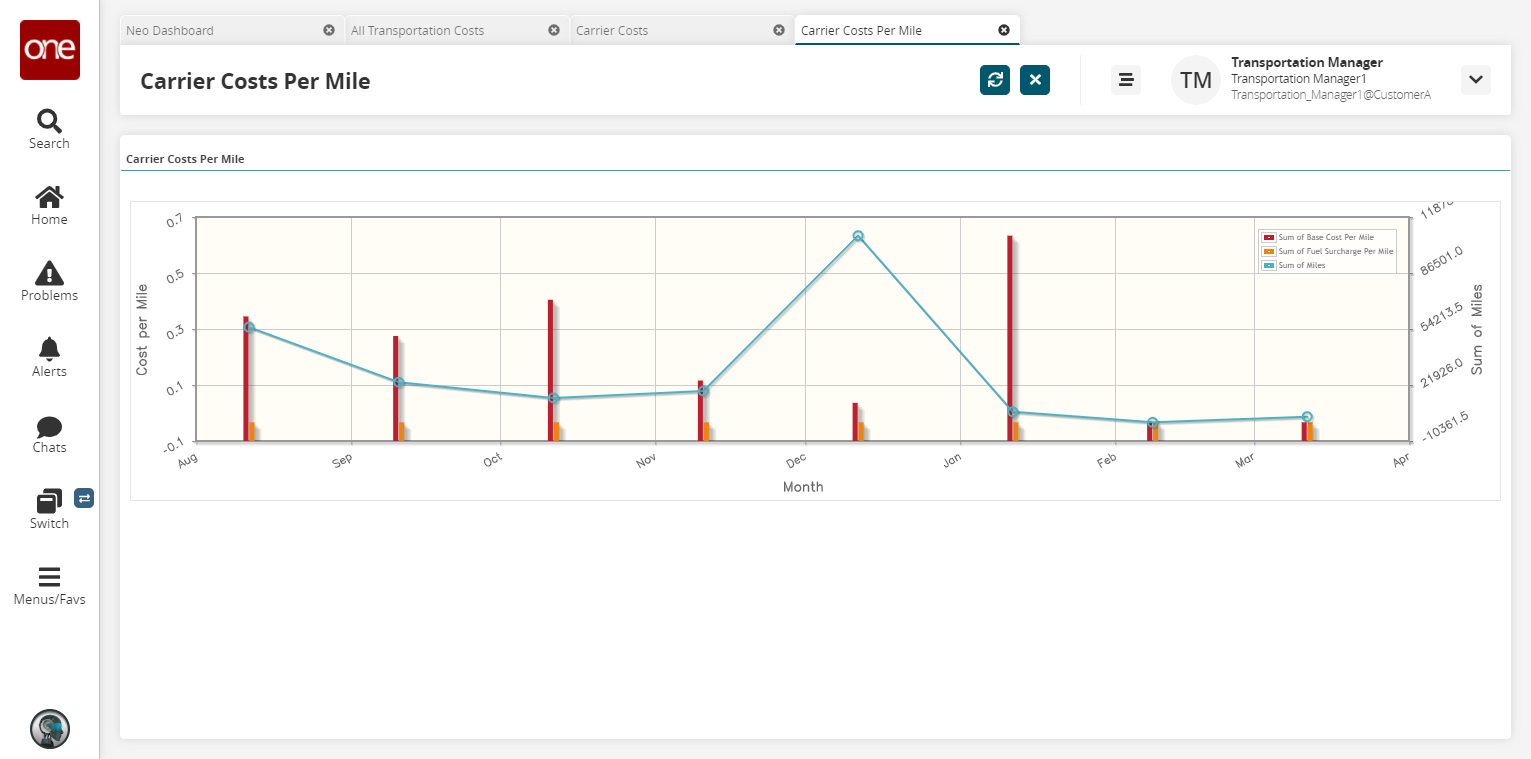
Carrier Costs per Mile
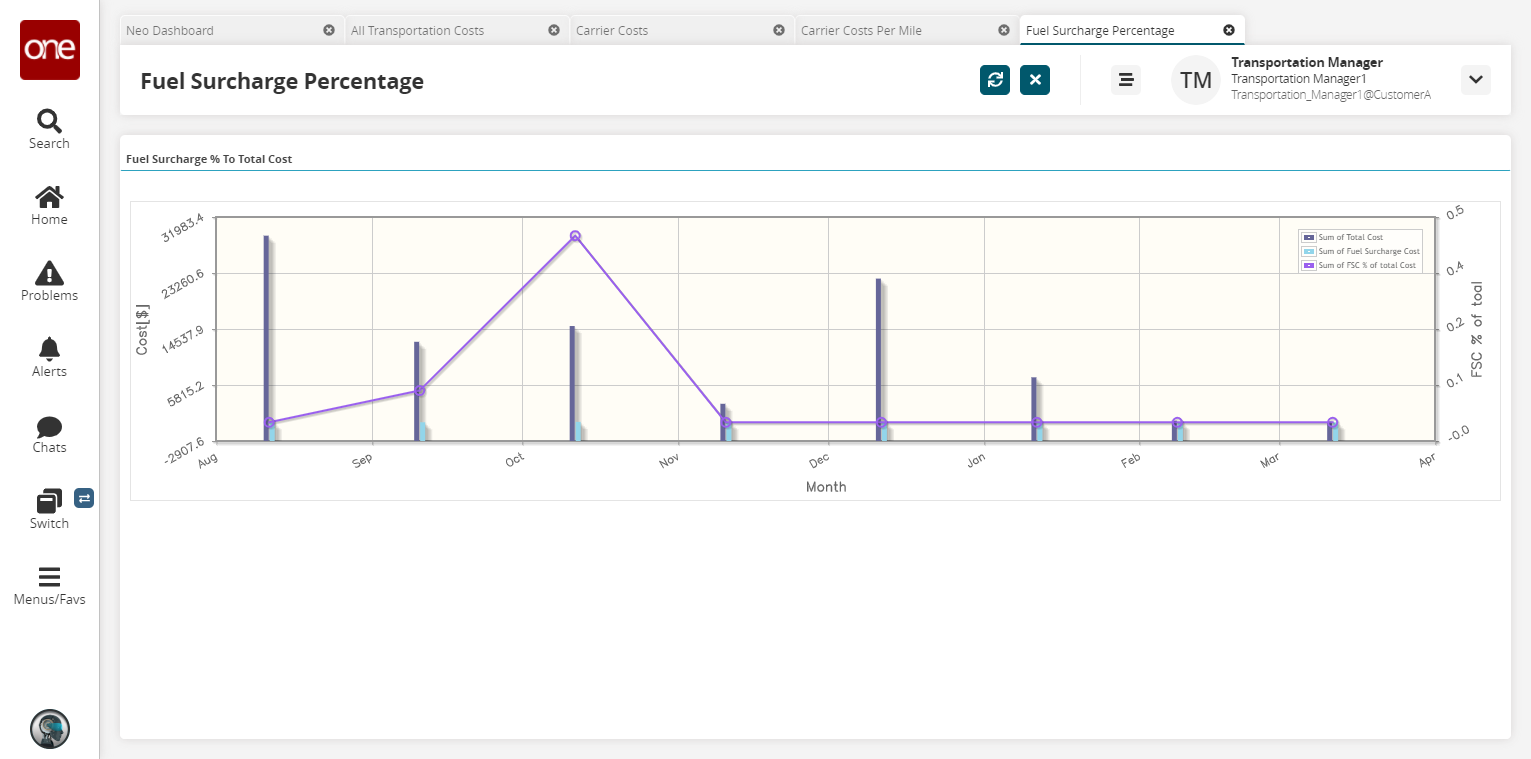
Fuel Surcharge Percentage
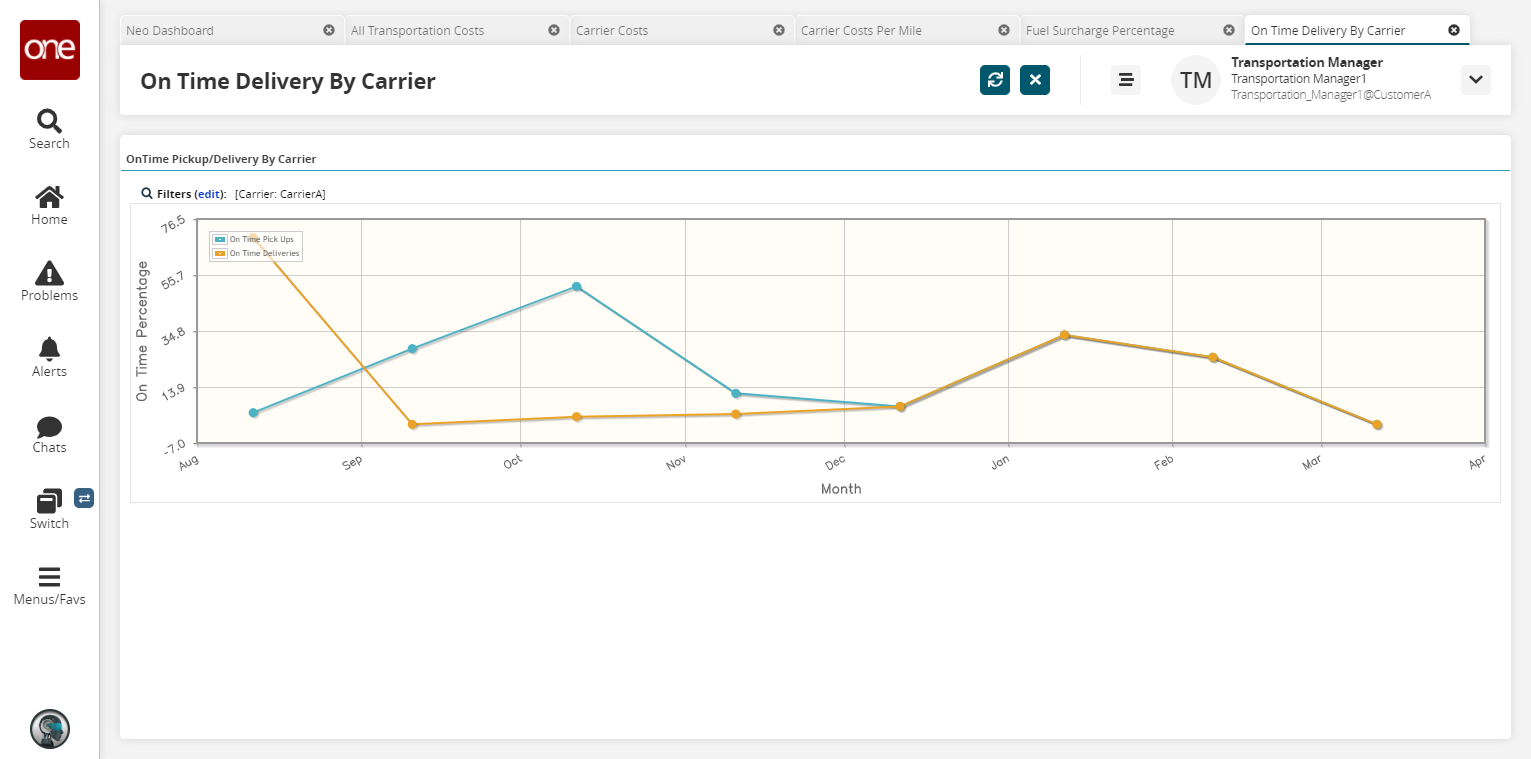
On-Time Delivery by Carrier
Lane Information
Rejected Tenders by Carrier
On-Time Schedule Percent by Carrier
Top Ten Lanes by Site
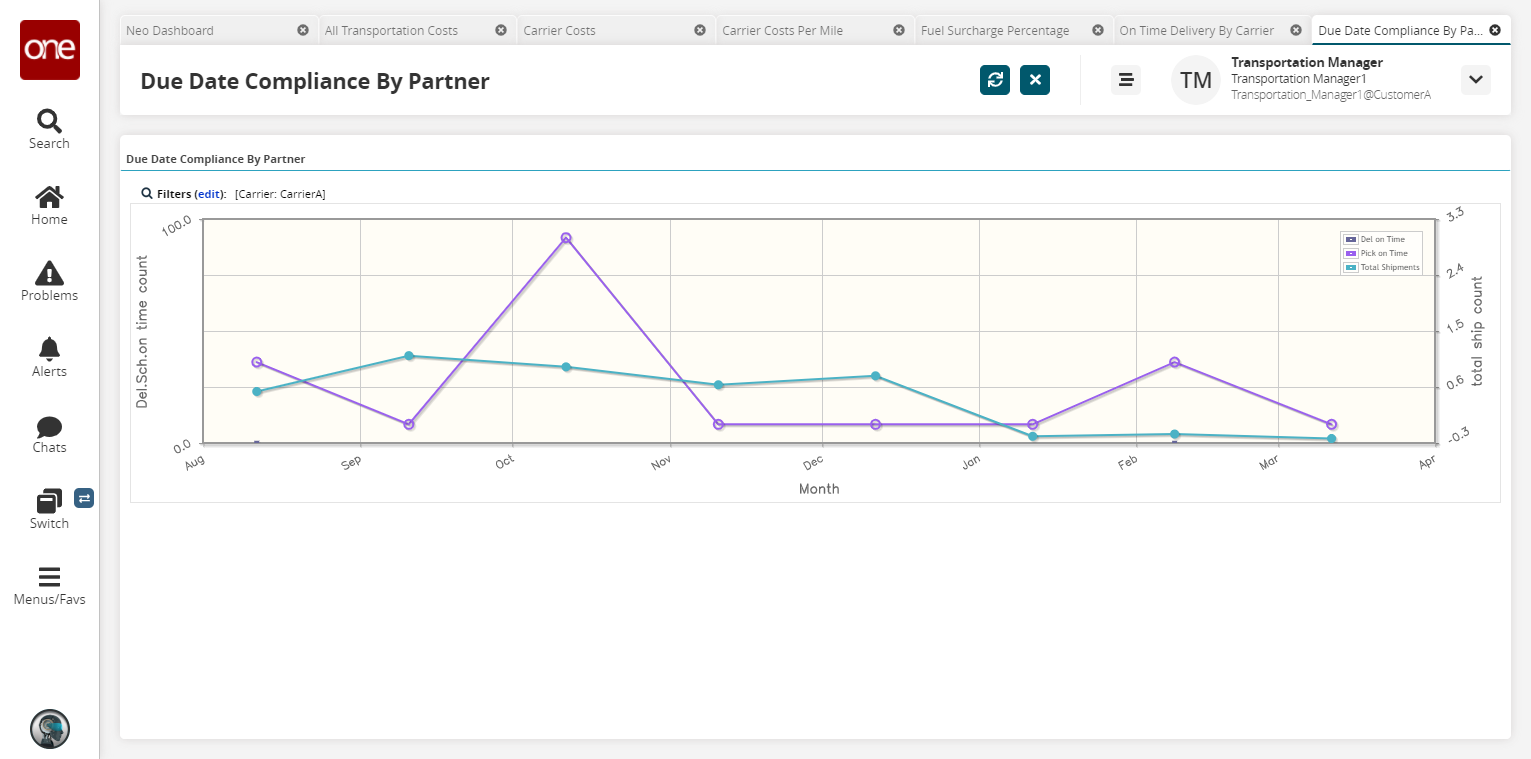
Due Date Compliance by Partner
The following example shows how to view a bar chart for All Transportation Costs. Similarly, you can view a bar chart for other KPI Metrics features using the same process.
Complete the following steps to view KPI metric bar charts:
L og in to the ONE system.
Select Menu/Favs > Reports > KPIs > All Transportation Costs.
In the NEO UI, users can click on the Menus/Favs icon on the left sidebar and type in the name of the screen in the menu search bar. For more information, see "Using the Menu Search Bar."
The All Transportation Costs tab appears, showing a bar chart with three metrics.
Carrier Costs
Carrier Costs Per Mile
Fuel Surcharge Percentage
On-Time Delivery By Carrier
Due Date Compliance By Partner