Master Data Sanity Check UI
Complete the following steps to configure and run the Demand Planning Master Data Sanity Check:
L og in to the ONE system.
Click Menus/Favs > Demand Planning > Master Data Sanity Check > Master Data Sanity Check UI.
The Master Data Sanity Check UI screen appears.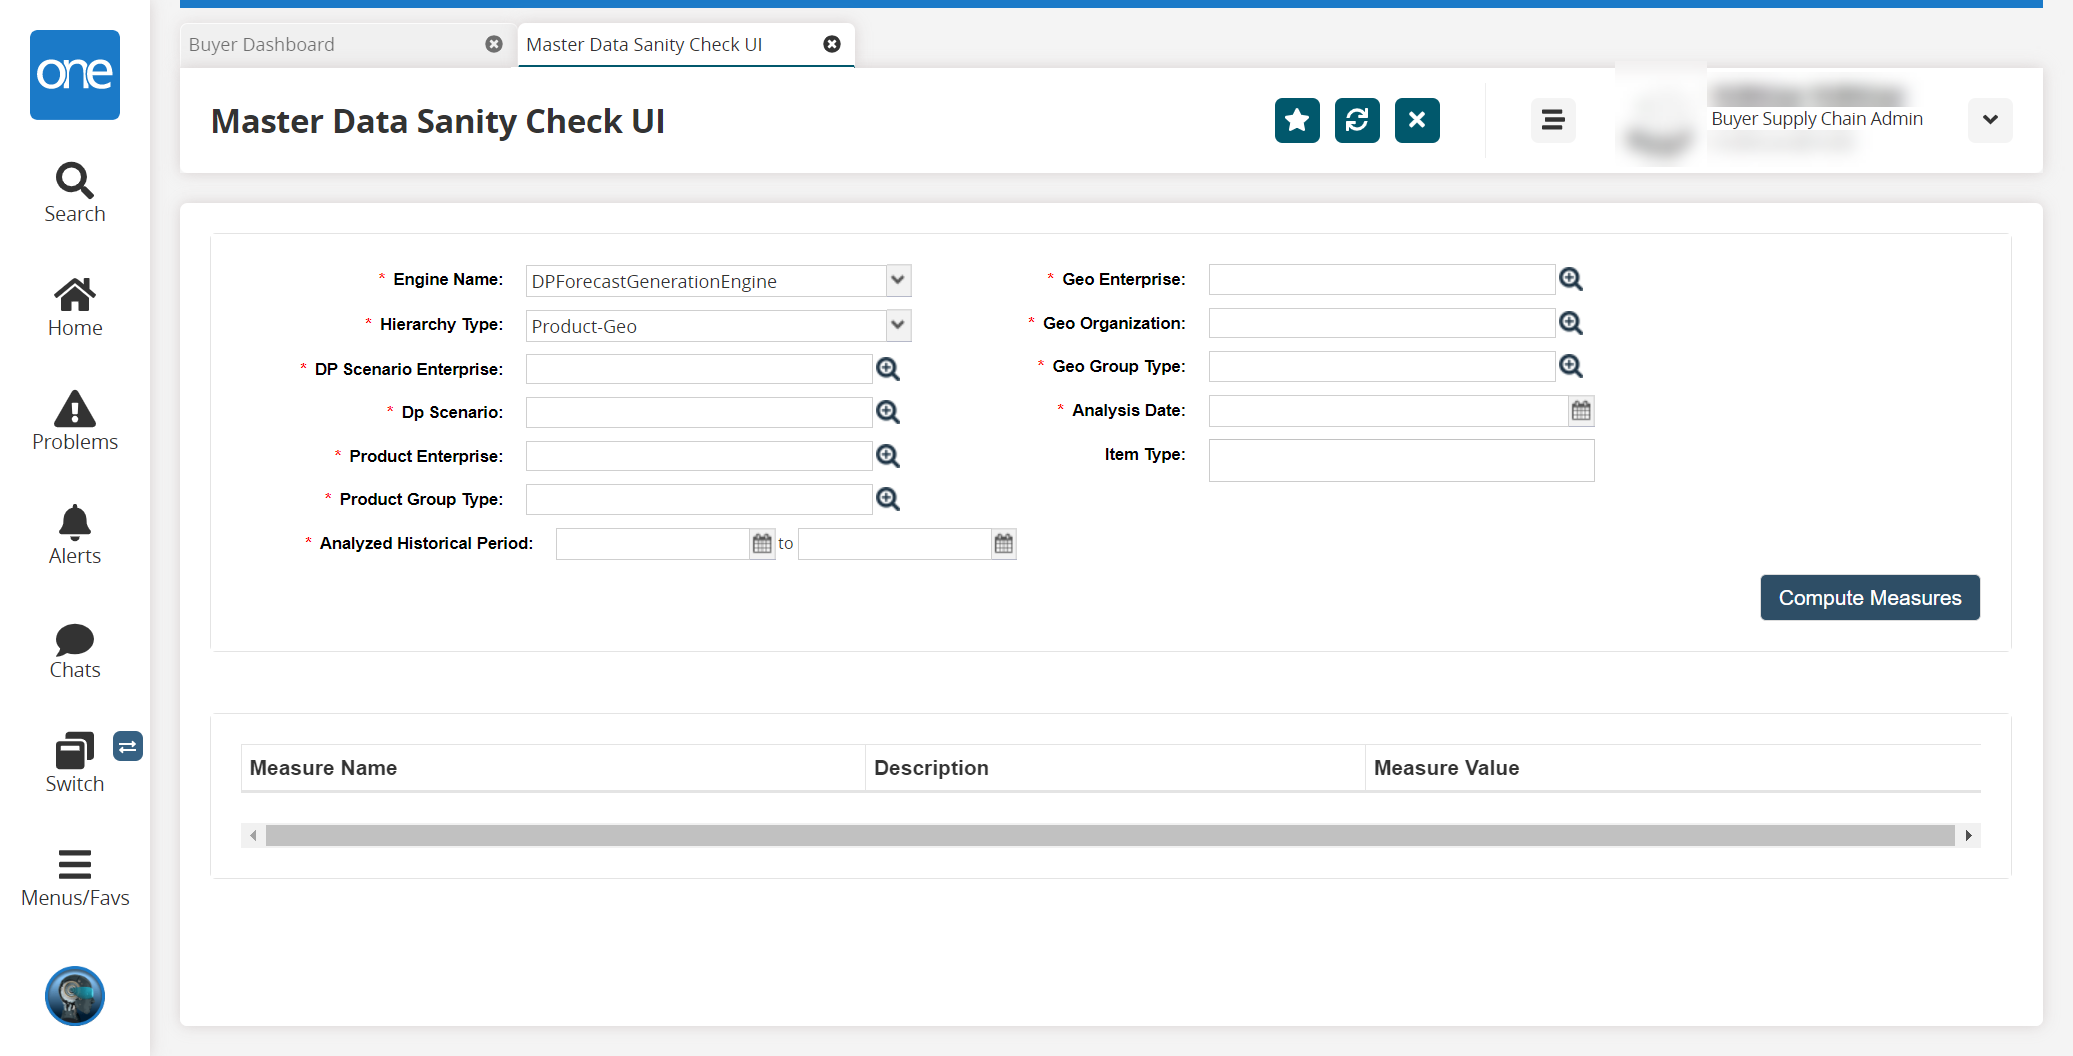
Fill out the following fields. Fields with an asterisk ( * ) are required.
Field
Description
* Engine Name
Select an engine for which you are doing a sanity check from the dropdown list. The choices are DP Forecast Generation Engine or Continuous Forecasting Engine.
* Hierarchy Type
Select a hierarchy type from the dropdown list.
* DP Scenario Enterprise
Use the picker tool to select the enterprise that owns the DP configuration (previously called a DP scenario).
* DP Scenario
Use the picker tool to select a demand planning (DP) configuration (previously called a DP scenario).
* Product Enterprise
Use the picker tool to select an enterprise.
* Product Group Type
Use the picker tool to select a product group type.
* Analyzed Historical Period (This field appears only if DP Forecast Generation Engine is selected for the sanity check.)
Click the calendar icons to select a historical period you are analyzing.
* Historical Horizon in Days (This field appears only if Continuous Forecasting Engine is selected.)
Enter a numerical value for the historical horizon in days.
* Geo Enterprise
Use the picker tool to select a geo enterprise.
* Geo Organization
Use the picker tool to select a geo organization.
* Geo Group Type
Use the picker tool to select a geo group type.
* Analysis Date
Click the calendar icon to select an analysis date.
Item Type
Enter an item type in the field.
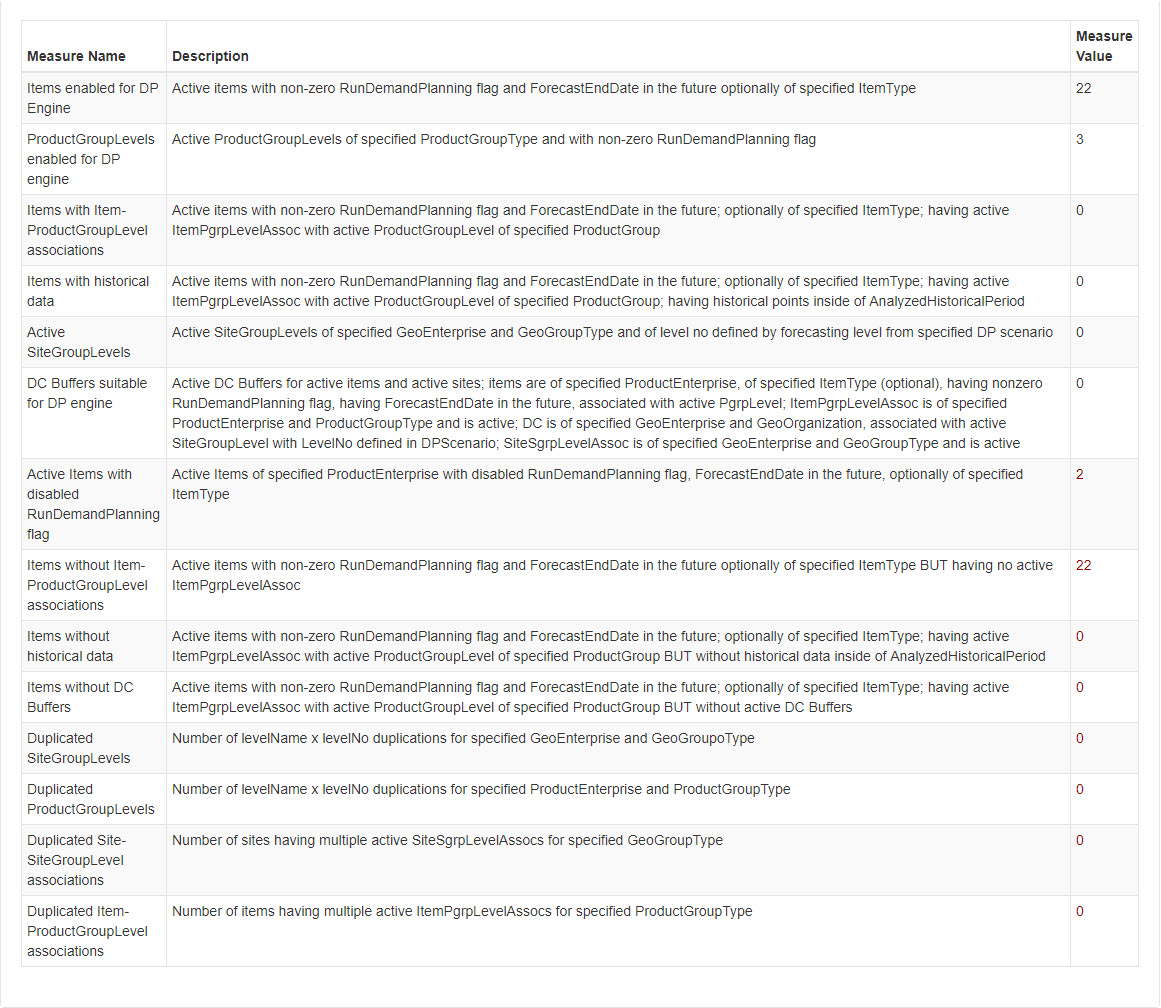
Click the Compute Measures button.
A list of measures appears in a table below the measures. If a parameter represents a problem with data, the value is entered in the Measure Values column as a clickable link which leads to a report containing more details about the issue.
The screen shown below is for the DP Forecast Generation Engine; fields for the CFM engine are slightly different.