Supply Demand Match
This topic describes how to work with the Supply Demand Match report to see data related to capacity and constraints.
Complete the following steps to view the Supply Demand Match report:
L og in to the ONE system.
Click Menus/Favs > IBP > Supply Demand Match.
The Supply Demand Match report displays.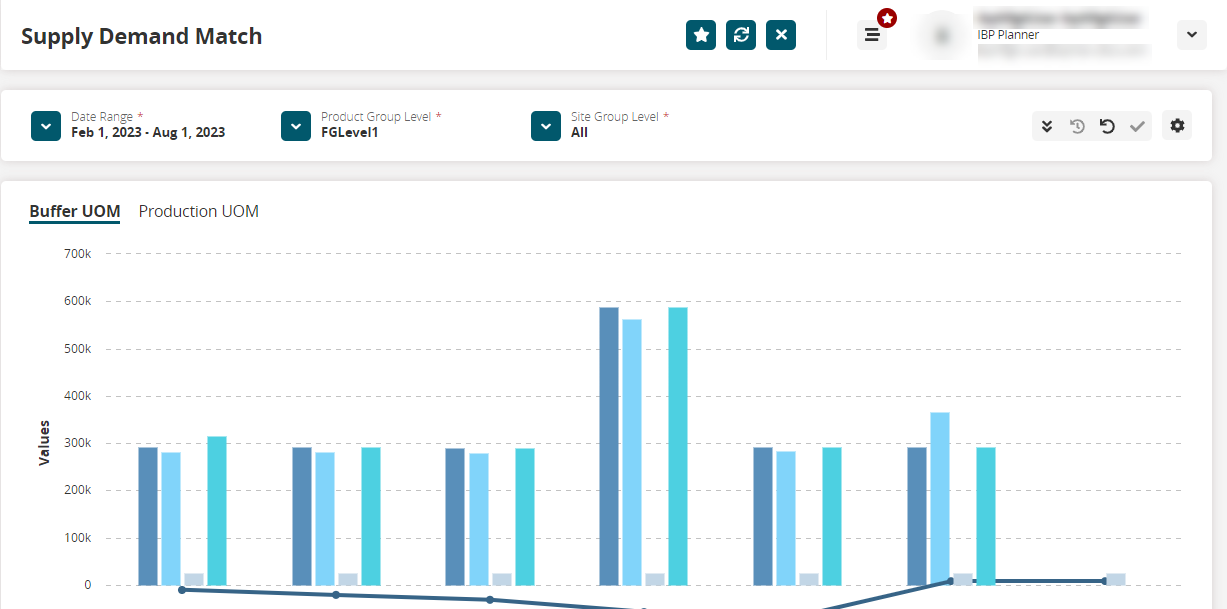
In the * Date Range field in the report header, select the desired date range from the dropdown list. Fields with an asterisk ( * ) are required.
In the * Product Group Level field in the report header, select the product group level from the dropdown list.
In the * Site Group Level field in the report header, select the site group level from the dropdown list.
Click the
 icon in the report header.
The Filter Options popup displays.In the * Scenario field, click the picker tool icon to select the desired scenario.
In the Site field, click the picker tool icon to select a site if desired.
In the Bucketization field, select a bucketization period from the dropdown if desired.
Set additional filters like Item, Site, and Bucketization as needed.
Click
 to apply the selected filters.
Note
You can click the undo icon (
 ) to undo changes and revert to the last applied filters, or you can click
  to apply the default filters.
Click the Fields (
 ) icon to select the data to view.
The Fields (Combination Chart) displays.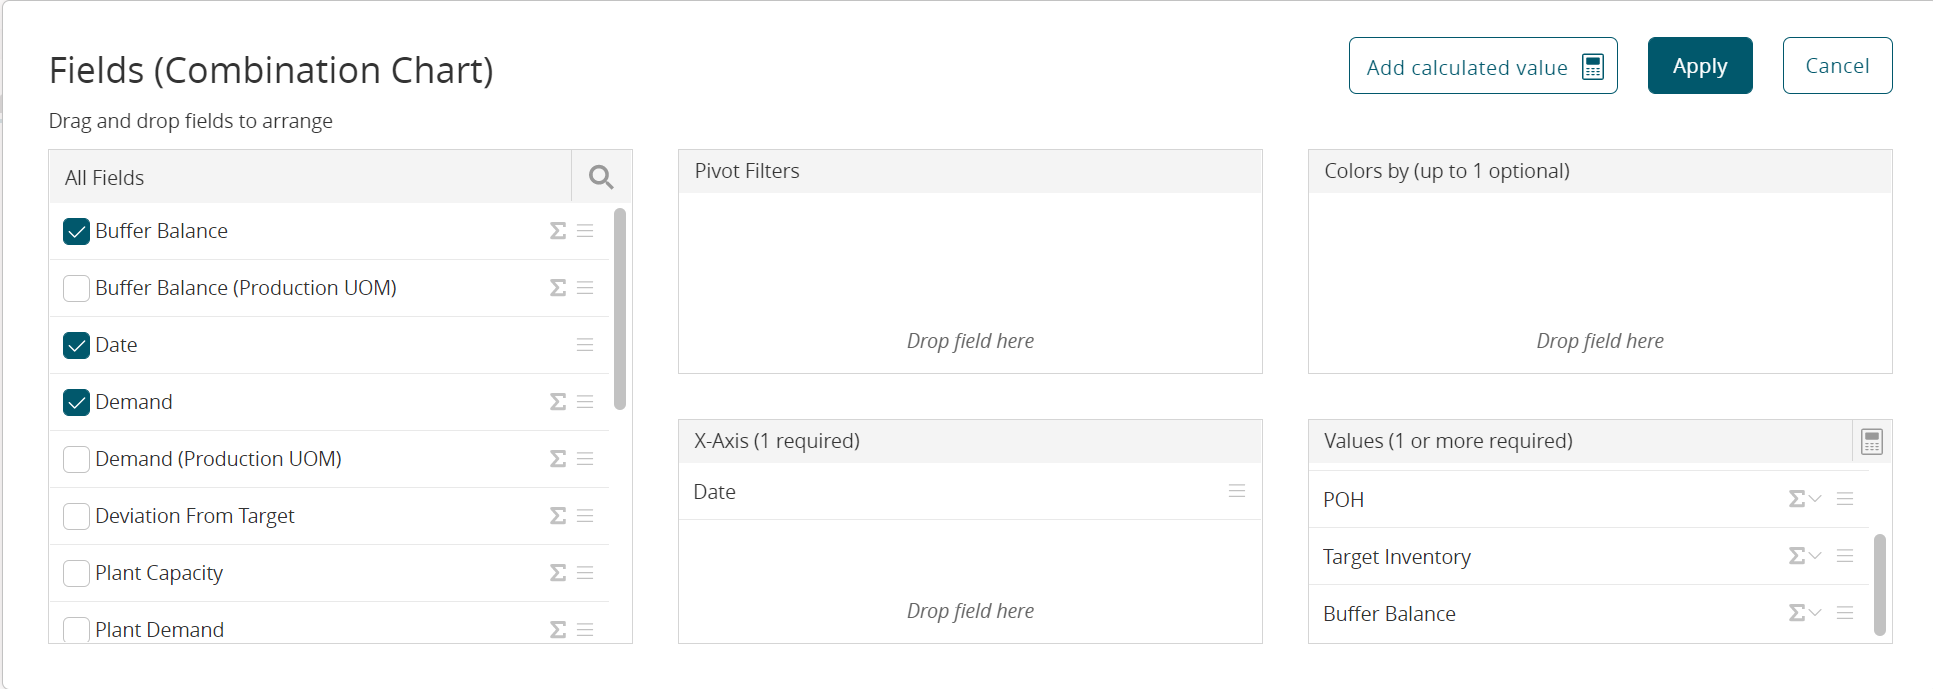
Select fields as desired. Drag and drop fields to arrange as desired.
Click the Apply button.
The Supply Demand Match report updates with the selected data.Scroll down the Supply Demand Match report screen to view the same data as a table.
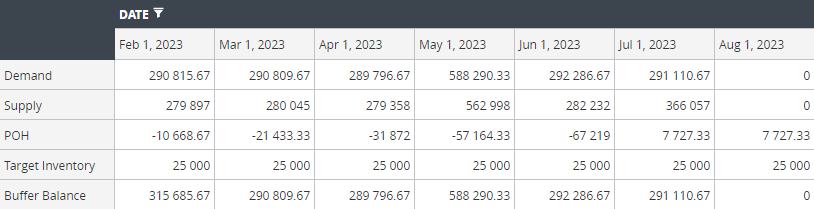
In the data table, click the Date filter icon to specify the date range and to filter the data by labels or values and click Apply.
The report screen updates.