Viewing the Analyze History Data Report
Complete the following steps to view the Analyze History Data report:
L og in to the ONE system.
Click Menus/Favs > Demand Planning > History Review > Analyze History Data. In the NEO UI, users can click on the Menus/Favs icon on the left sidebar and type in the name of the screen in the menu search bar. For more information, see "Using the Menu Search Bar."
The Analyze History Data screen displays the Filters header by default.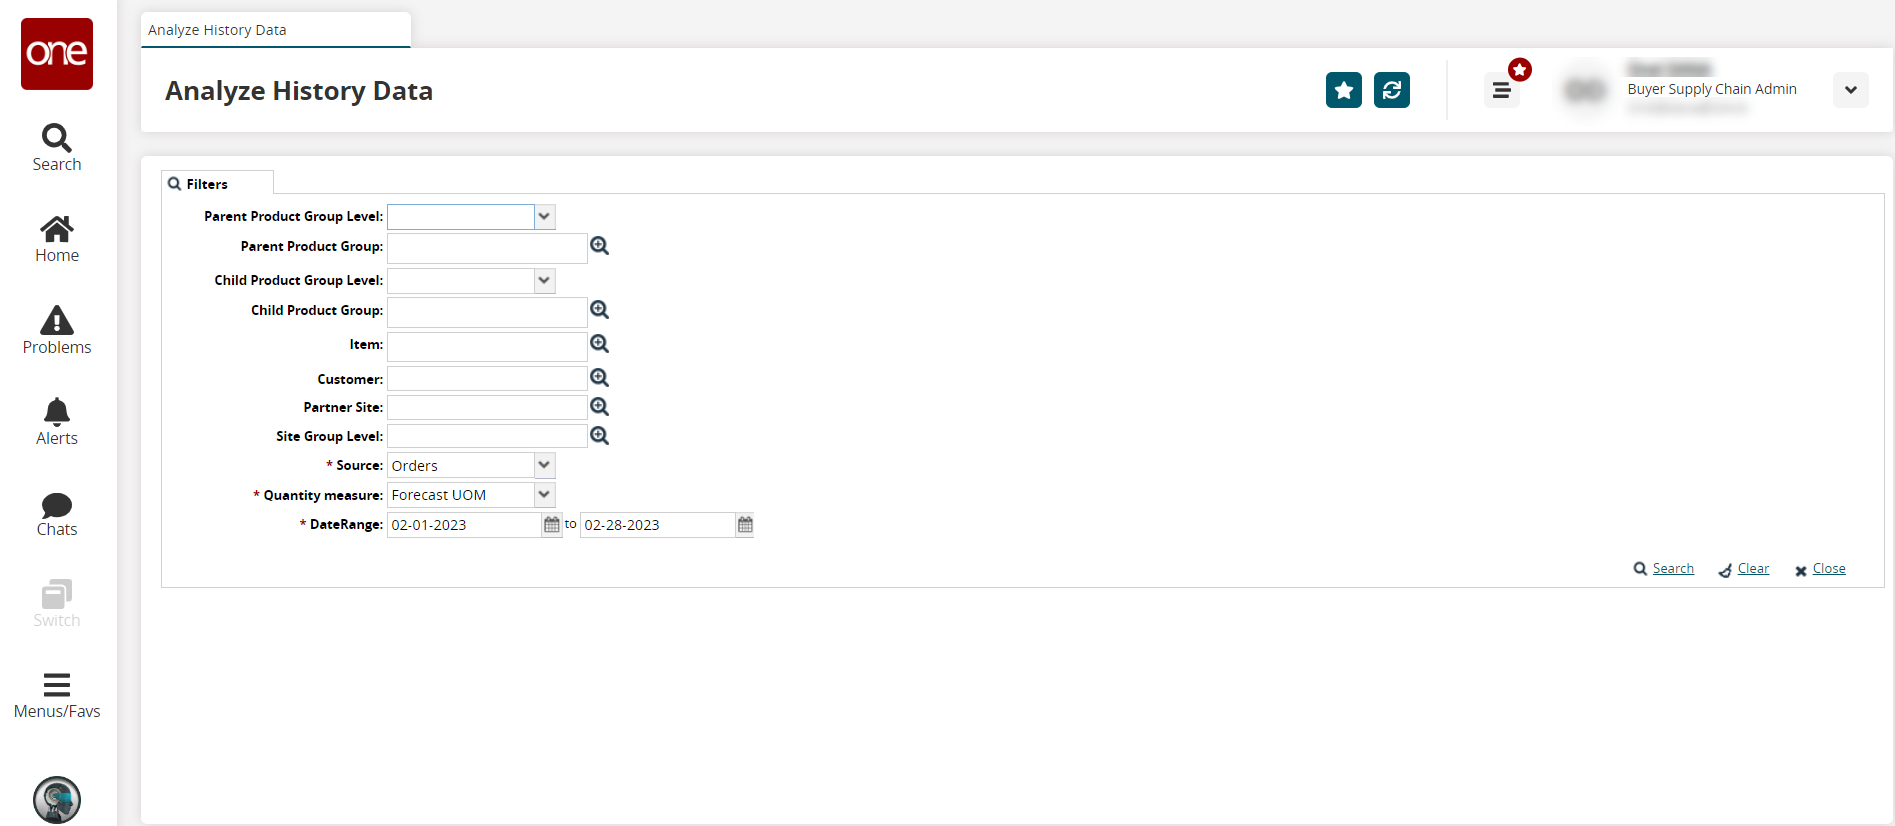
Enter values for fields described in the table below. Fields with an asterisk ( * ) are required.
Field
Description
Parent Product Group Level
Select the parent product's group level from the dropdown list.
Parent Product Group
Enter or use the picker tool to select the parent product group.
Child Product Group Level
Select the child product's group level from the dropdown list.
Child Product Group
Enter or use the picker tool to select the child product group.
Item
Enter or use the picker tool to select the item.
Customer
Enter or use the picker tool to select the customer.
Partner Site
Enter or use the picker tool to select the partner's site.
Site Group Level
Enter or use the picker tool to select the site group level.
* Forecast Type
Select the forecast type from the dropdown list.
* Quantity measure
Select the quantity measure from the dropdown list.
* Date Range
Use the calendar tool to select the beginning and end dates for the data.
Click the Search link.
The search results display.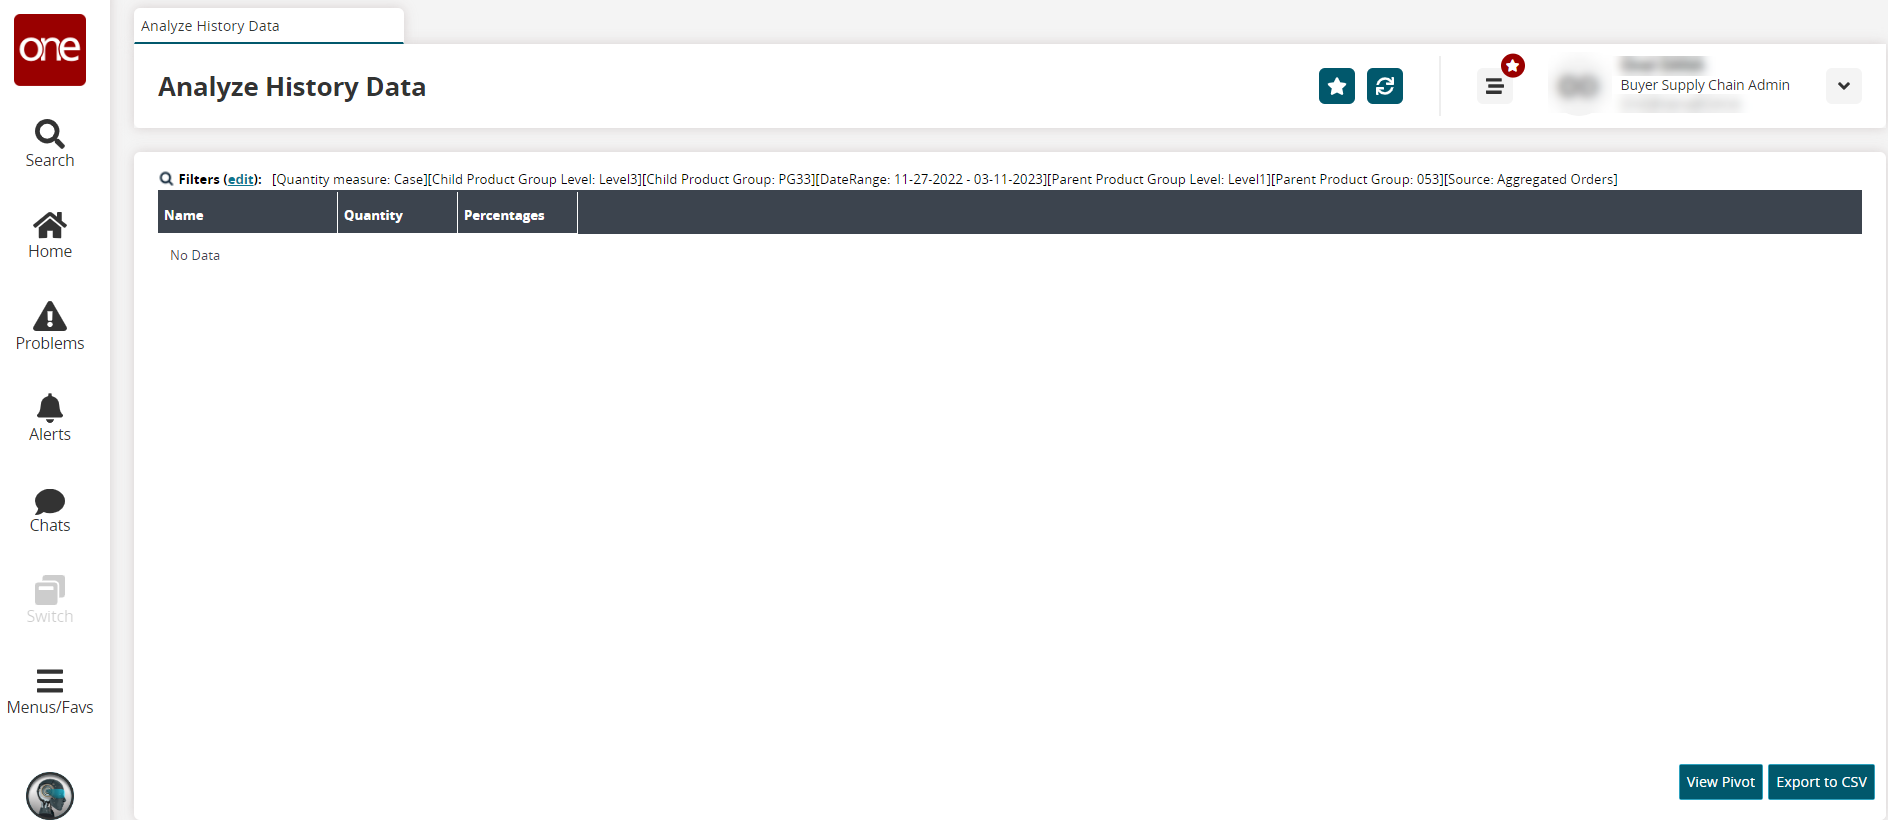
Click the View Pivot button to view the data in a pivot chart.
Click the Export to CSV button to export the report to a CSV file.