Viewing the Outliers Adjustment TLV Report
Users can view the outliers adjustment timeline on the Outliers Adjustment Timeline View (TLV).
Complete the following steps to view the Outliers Adjustment Timeline View (TLV):
Log in to the ONE system.
Click Menus/Favs > Demand Planning > Outliers > Outliers Adjustment TLV.
The Outliers Adjustment TLV screen displays.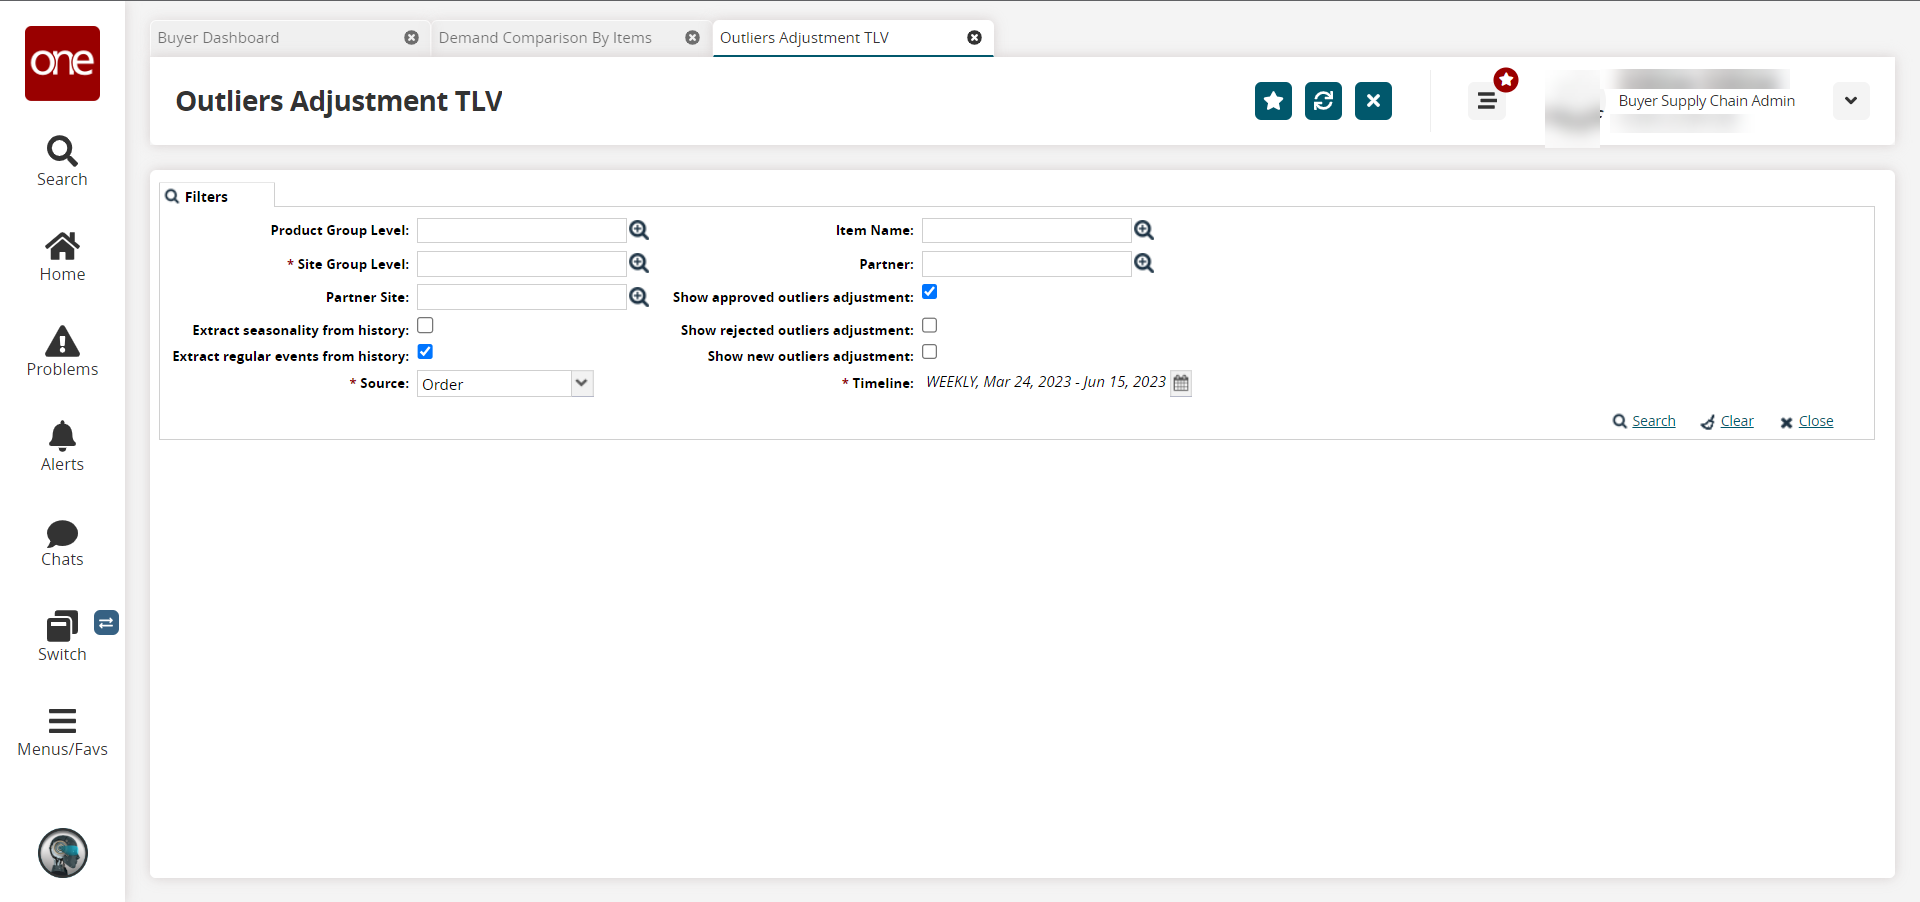
Fill out the following fields. Fields with an asterisk ( * ) are required.
Field
Description
Product Group Level
Click the picker tool icon to select the product group level.
*Site Group Level
Click the picker tool icon to select the site group level.
Partner Site
Click the picker tool icon to select the partner site.
Extract seasonality from history
Select the checkbox to extract seasonality from the history.
Extract regular events from history
Select the checkbox to extract regular events from the history.
*Source
Select the data source from the dropdown list.
Item Name
Click the picker tool icon to select the item.
Partner
Click the picker tool icon to select the partner.
Show approved outliers adjustment
Select the checkbox if desired.
Show rejected outliers adjustment
Select the checkbox if desired.
Show new outliers adjustment
Select the checkbox if desired.
*Timeline
Click the calendar icon
 to change the default timeline.
Click the dropdown menu to select a bucketization type in the Bucketization field.
Enter a date or click the calendar icon
 to select a date range in the Date Range field.
Click the Search link.
The Outliers Adjustment TLV screen displays the data according to the values entered in the filter fields.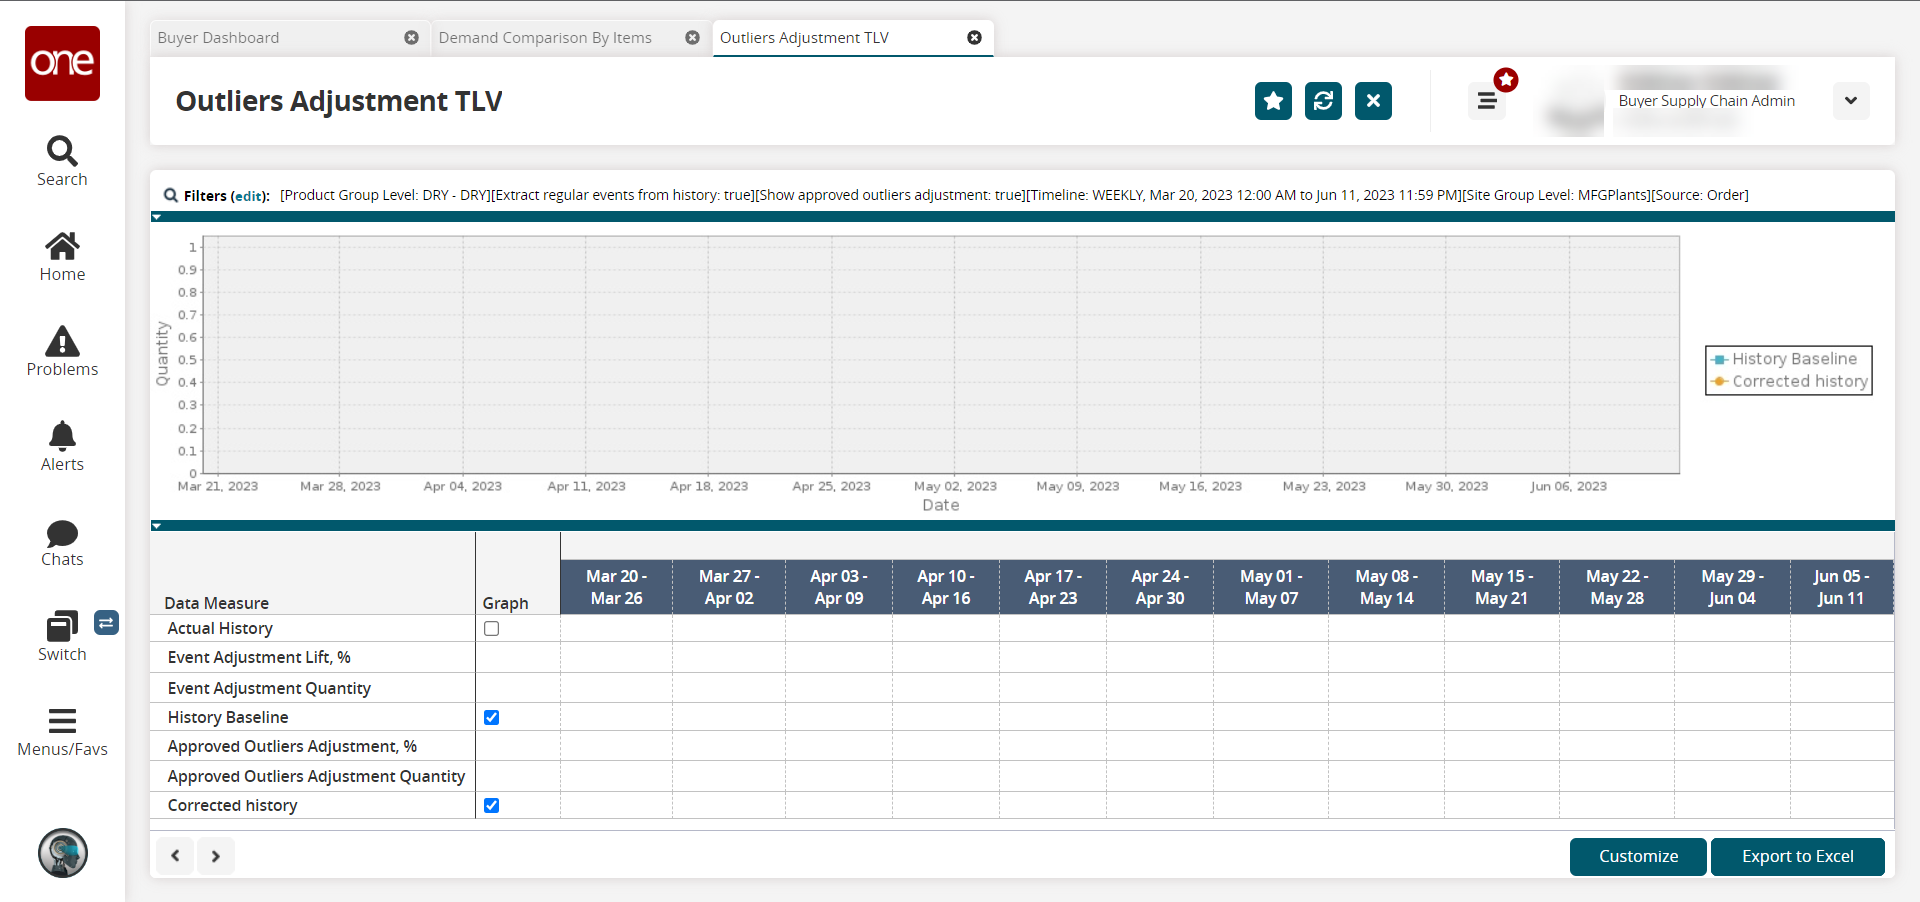
Click Customize to set the preference of your choice.
To save all changes made, click the Finish Customizing button.
To reset the report to default, click Reset To Default.
To export the report into a spreadsheet, click Export to Excel.