Working with Machine Learning Pipelines
Machine learning (ML) is a digital tool used to make predictions. Data scientists train a model using a data set to prepare a machine learning algorithm with a machine learning model; this model can then make predictions based on learned patterns in the data.
An ML pipeline is an end-to-end framework that directs data flows into and out of a machine learning model. In other words, the pipeline allows users to get data in and out of NEO for the purpose of delegating decisions to a machine learning model. An ML pipeline adapts between ONE's inputs and the ML model's inputs.
Users can view and edit the ML pipeline for any ML plug point.
Complete the following steps to view or edit an ML pipeline:
Log in to the ONE system.
Click Menu/Favs > Tools > Machine Learning > Machine Learning Plug Point.
The Machine Learning Plug Point screen appears.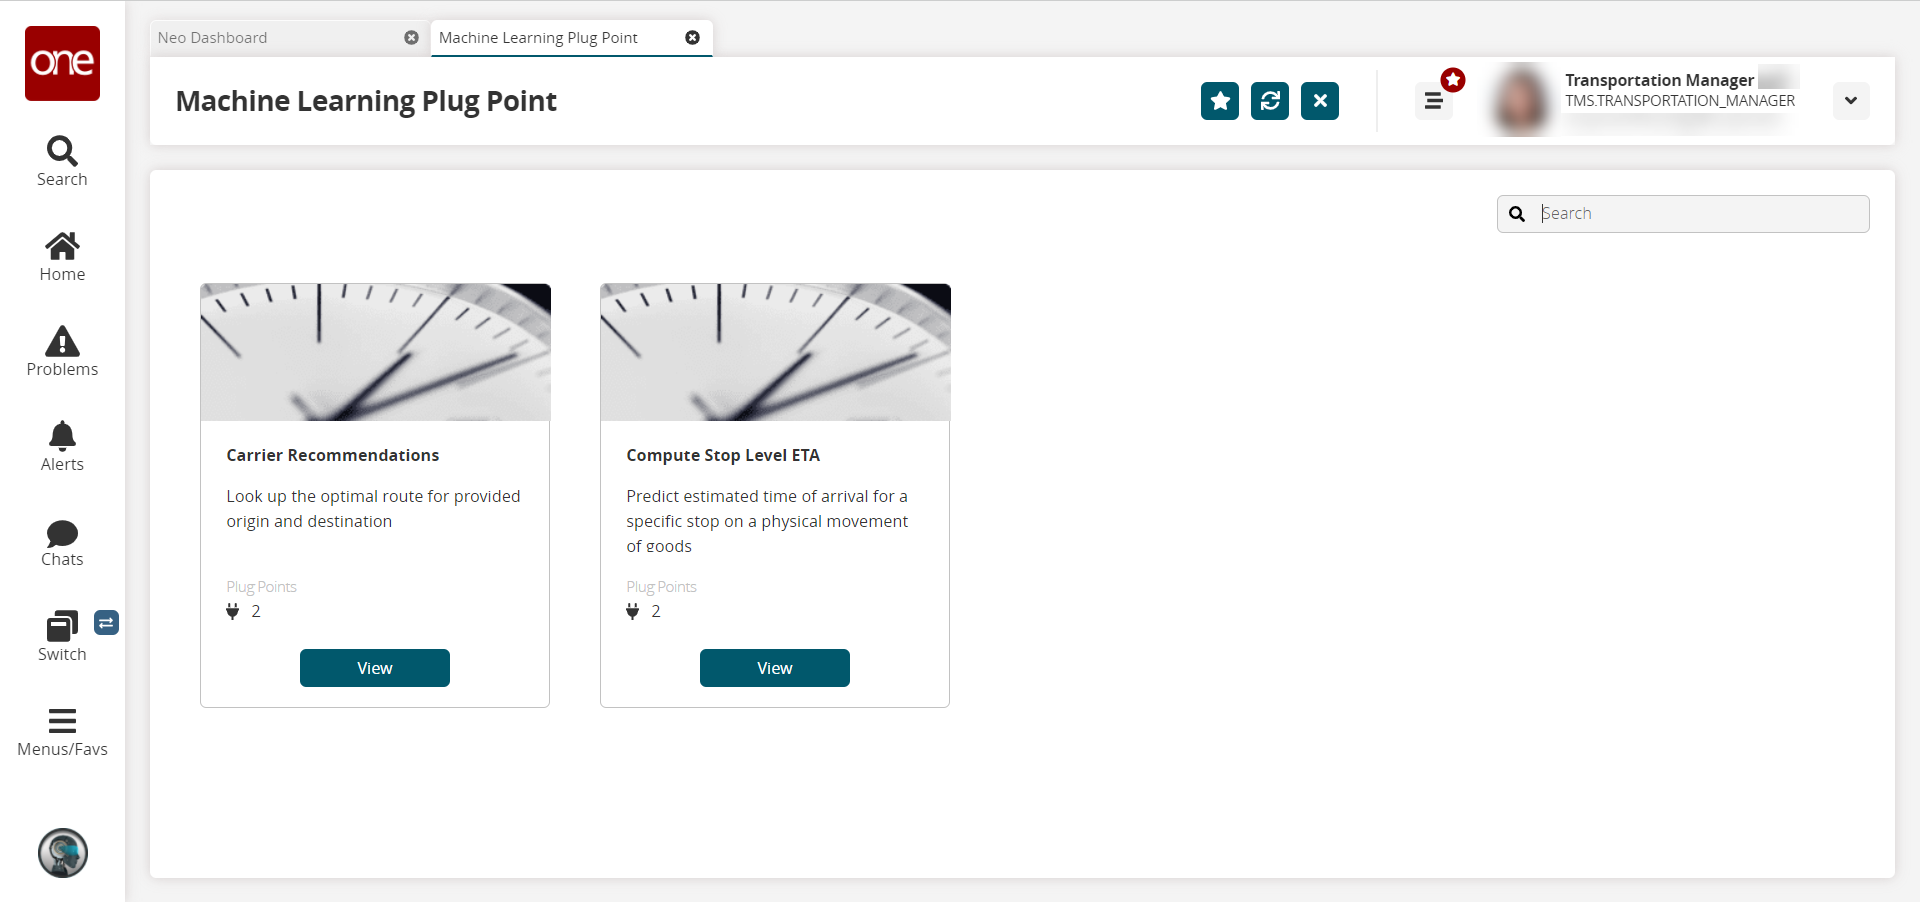
Click the View button for the ML plug point whose pipeline you wish to view or edit. For this example, we selected Compute Stop Level ETA.
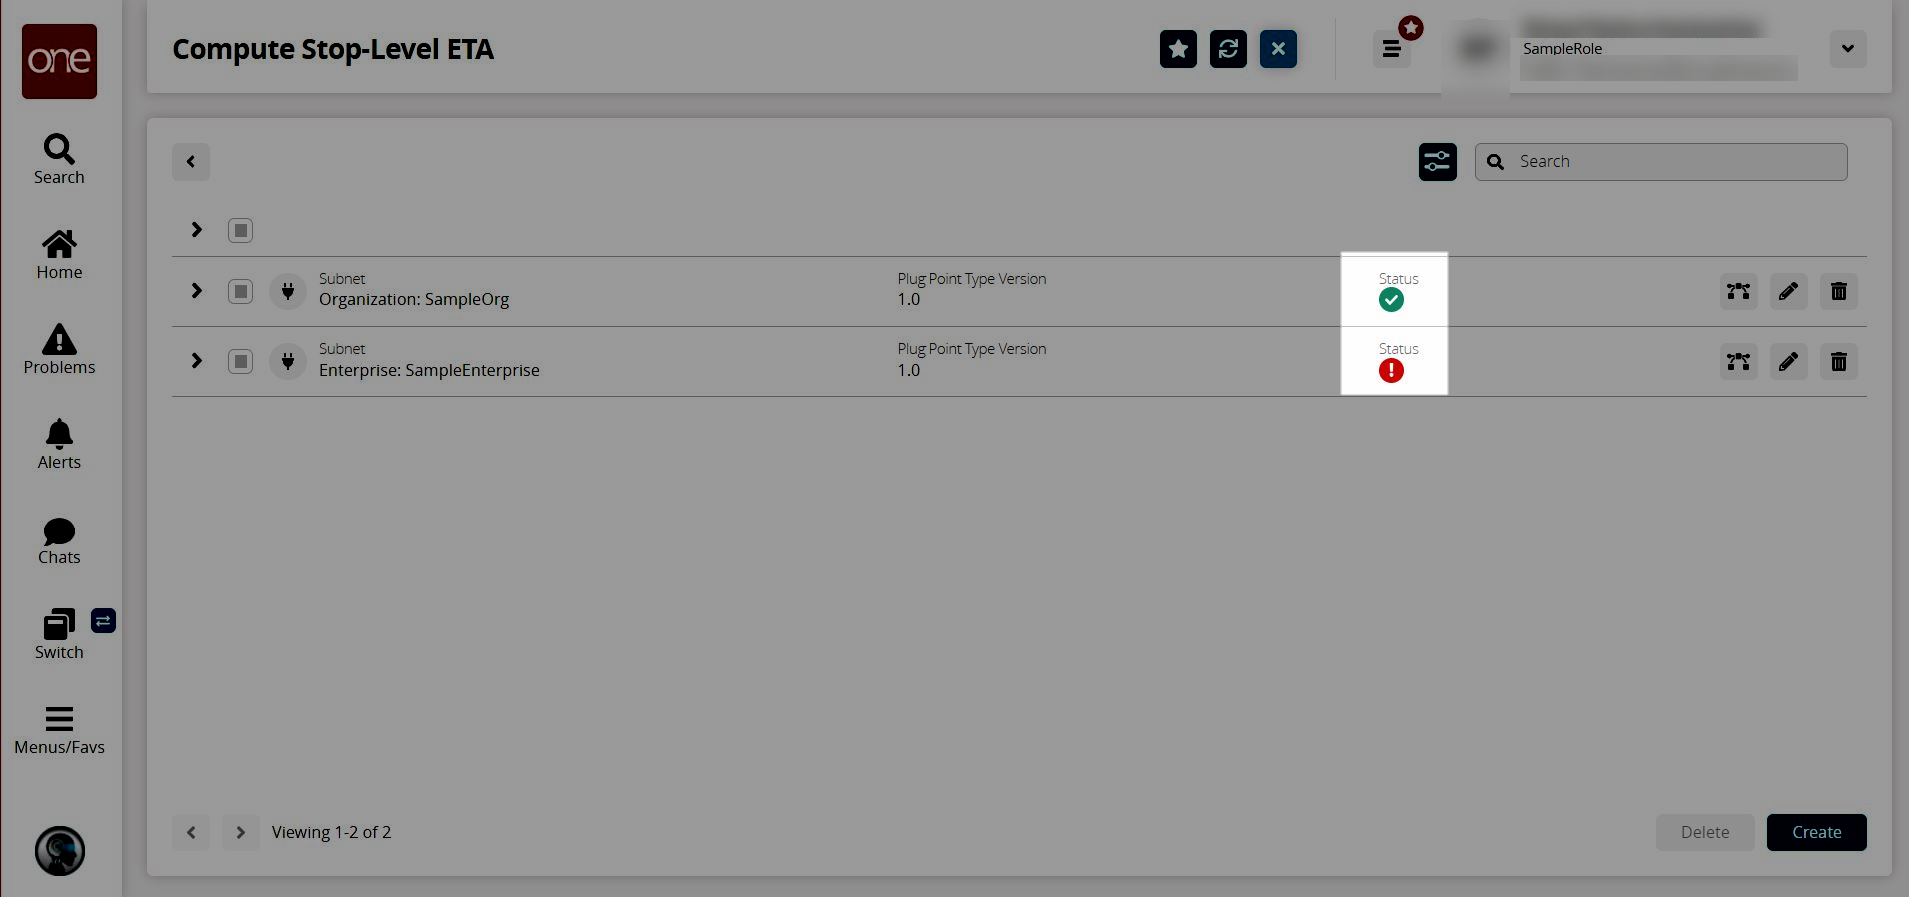
The Compute Stop Level ETA screen appears with the existing pipelines displayed along with their statuses.A green icon with a checkmark indicates the pipeline is valid. A red icon with an exclamation point indicates the pipeline is invalid
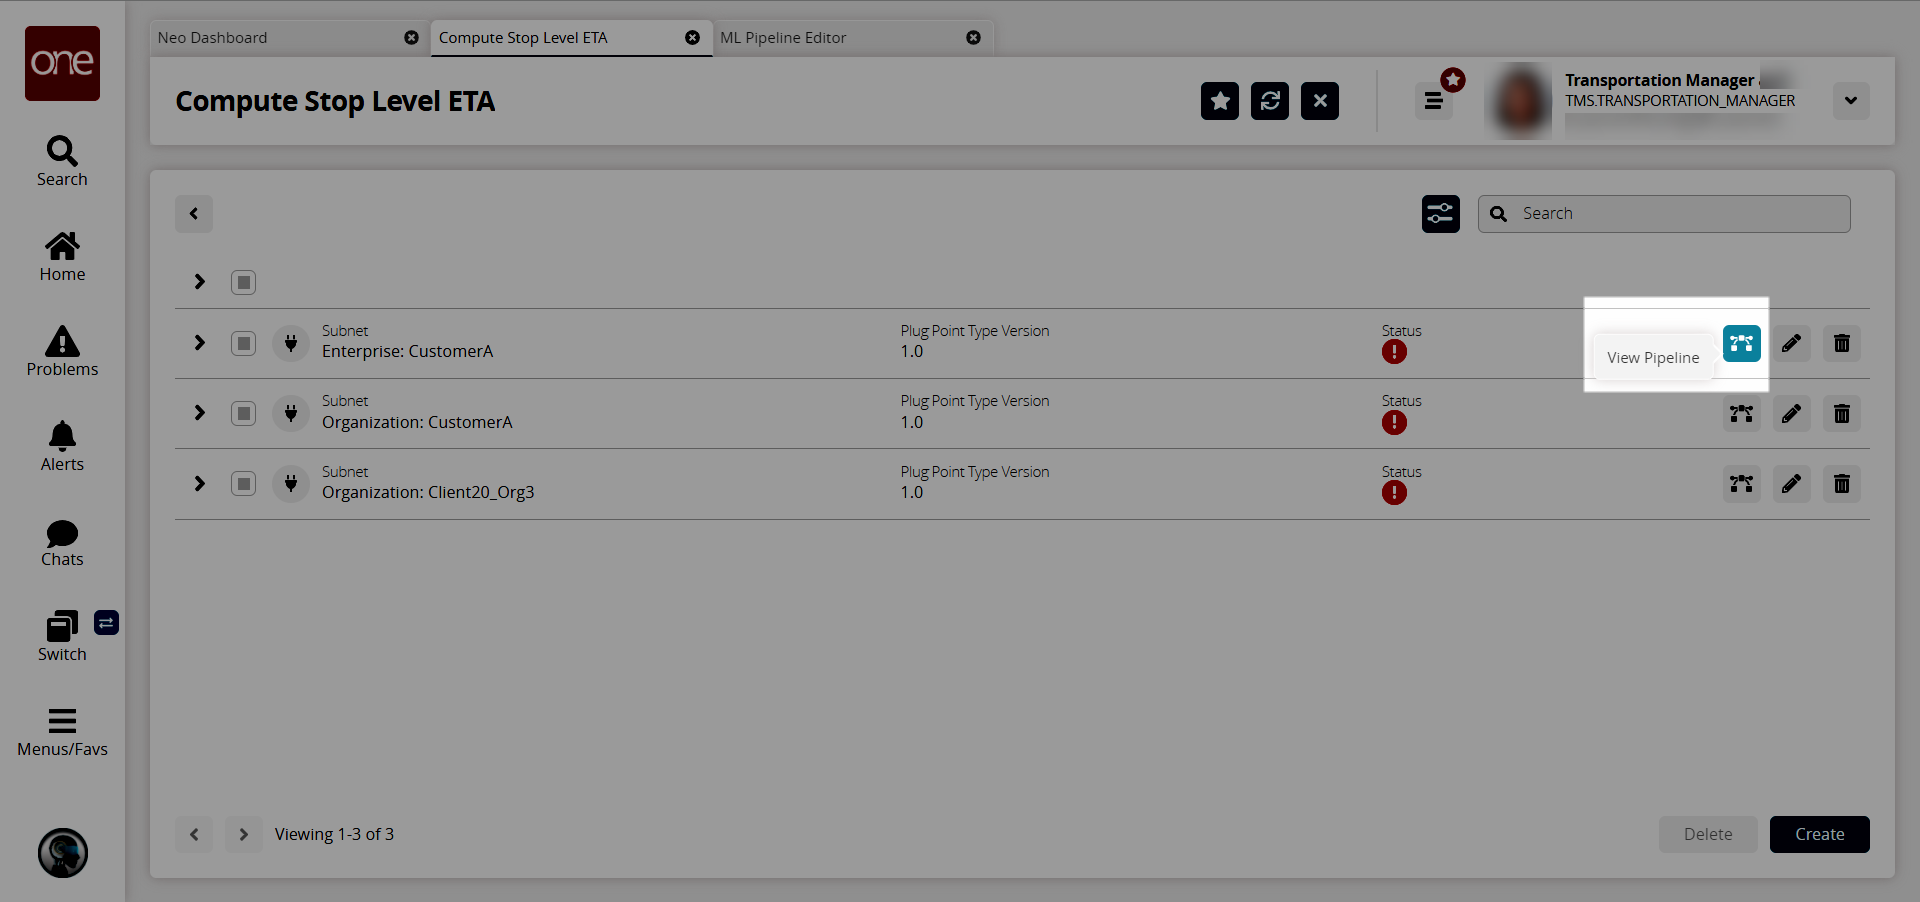
Click the View Pipeline icon for the plug point you wish to view.
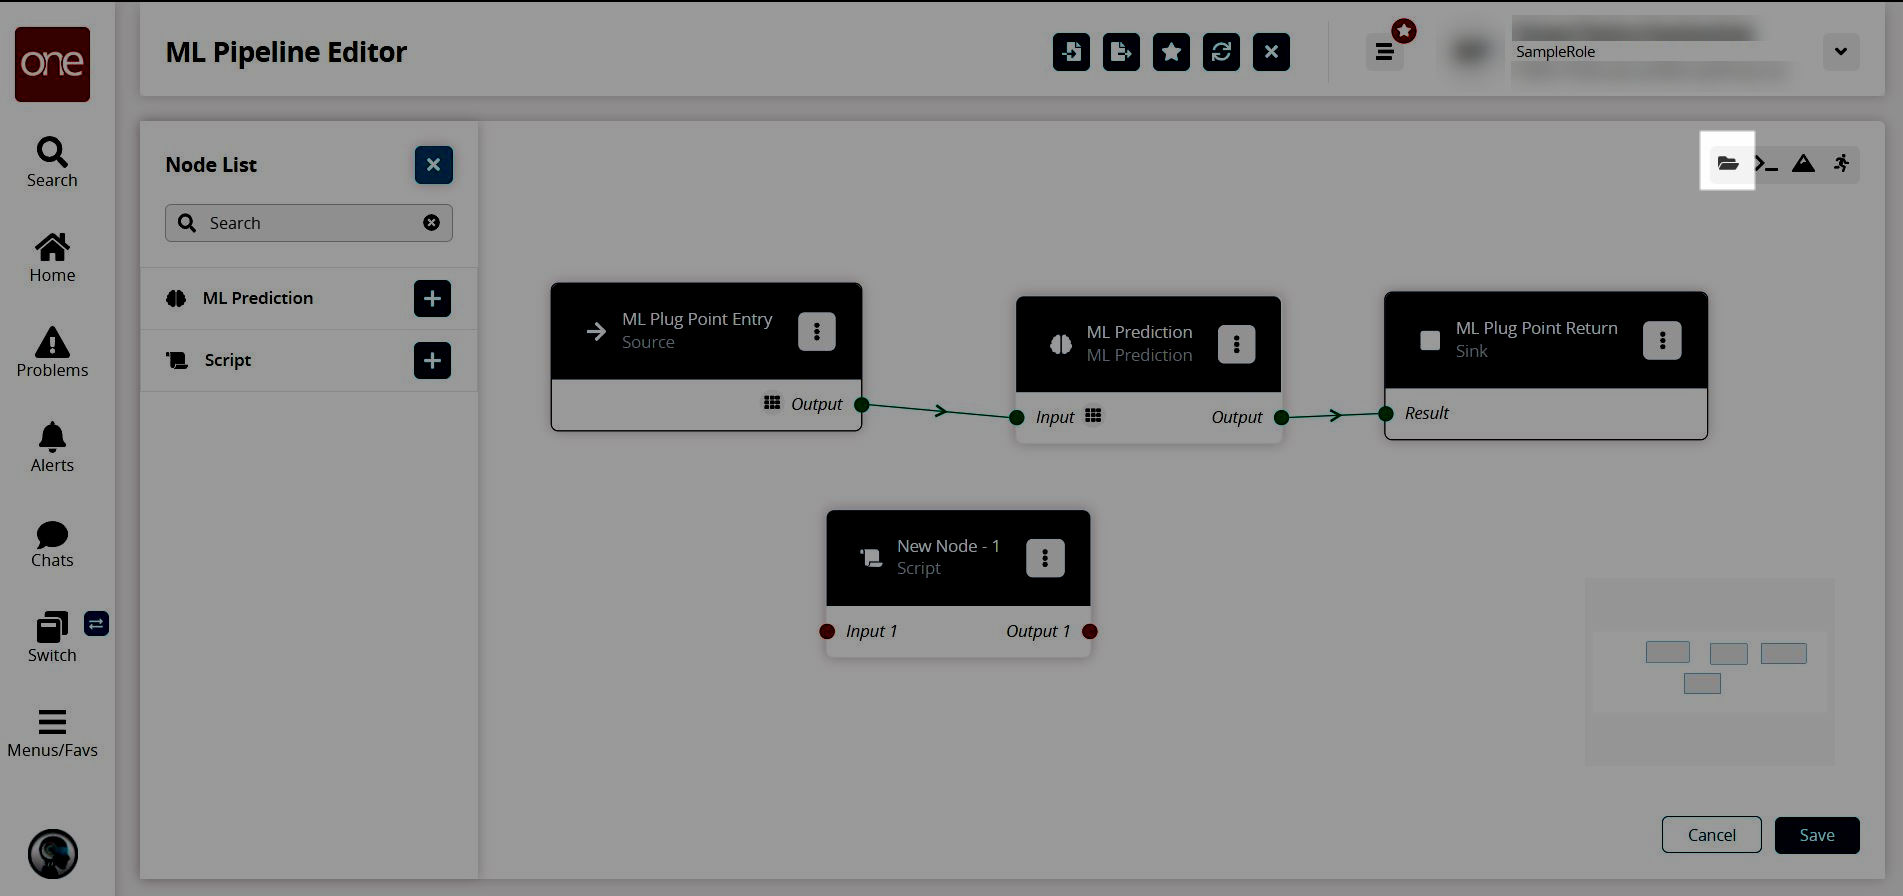
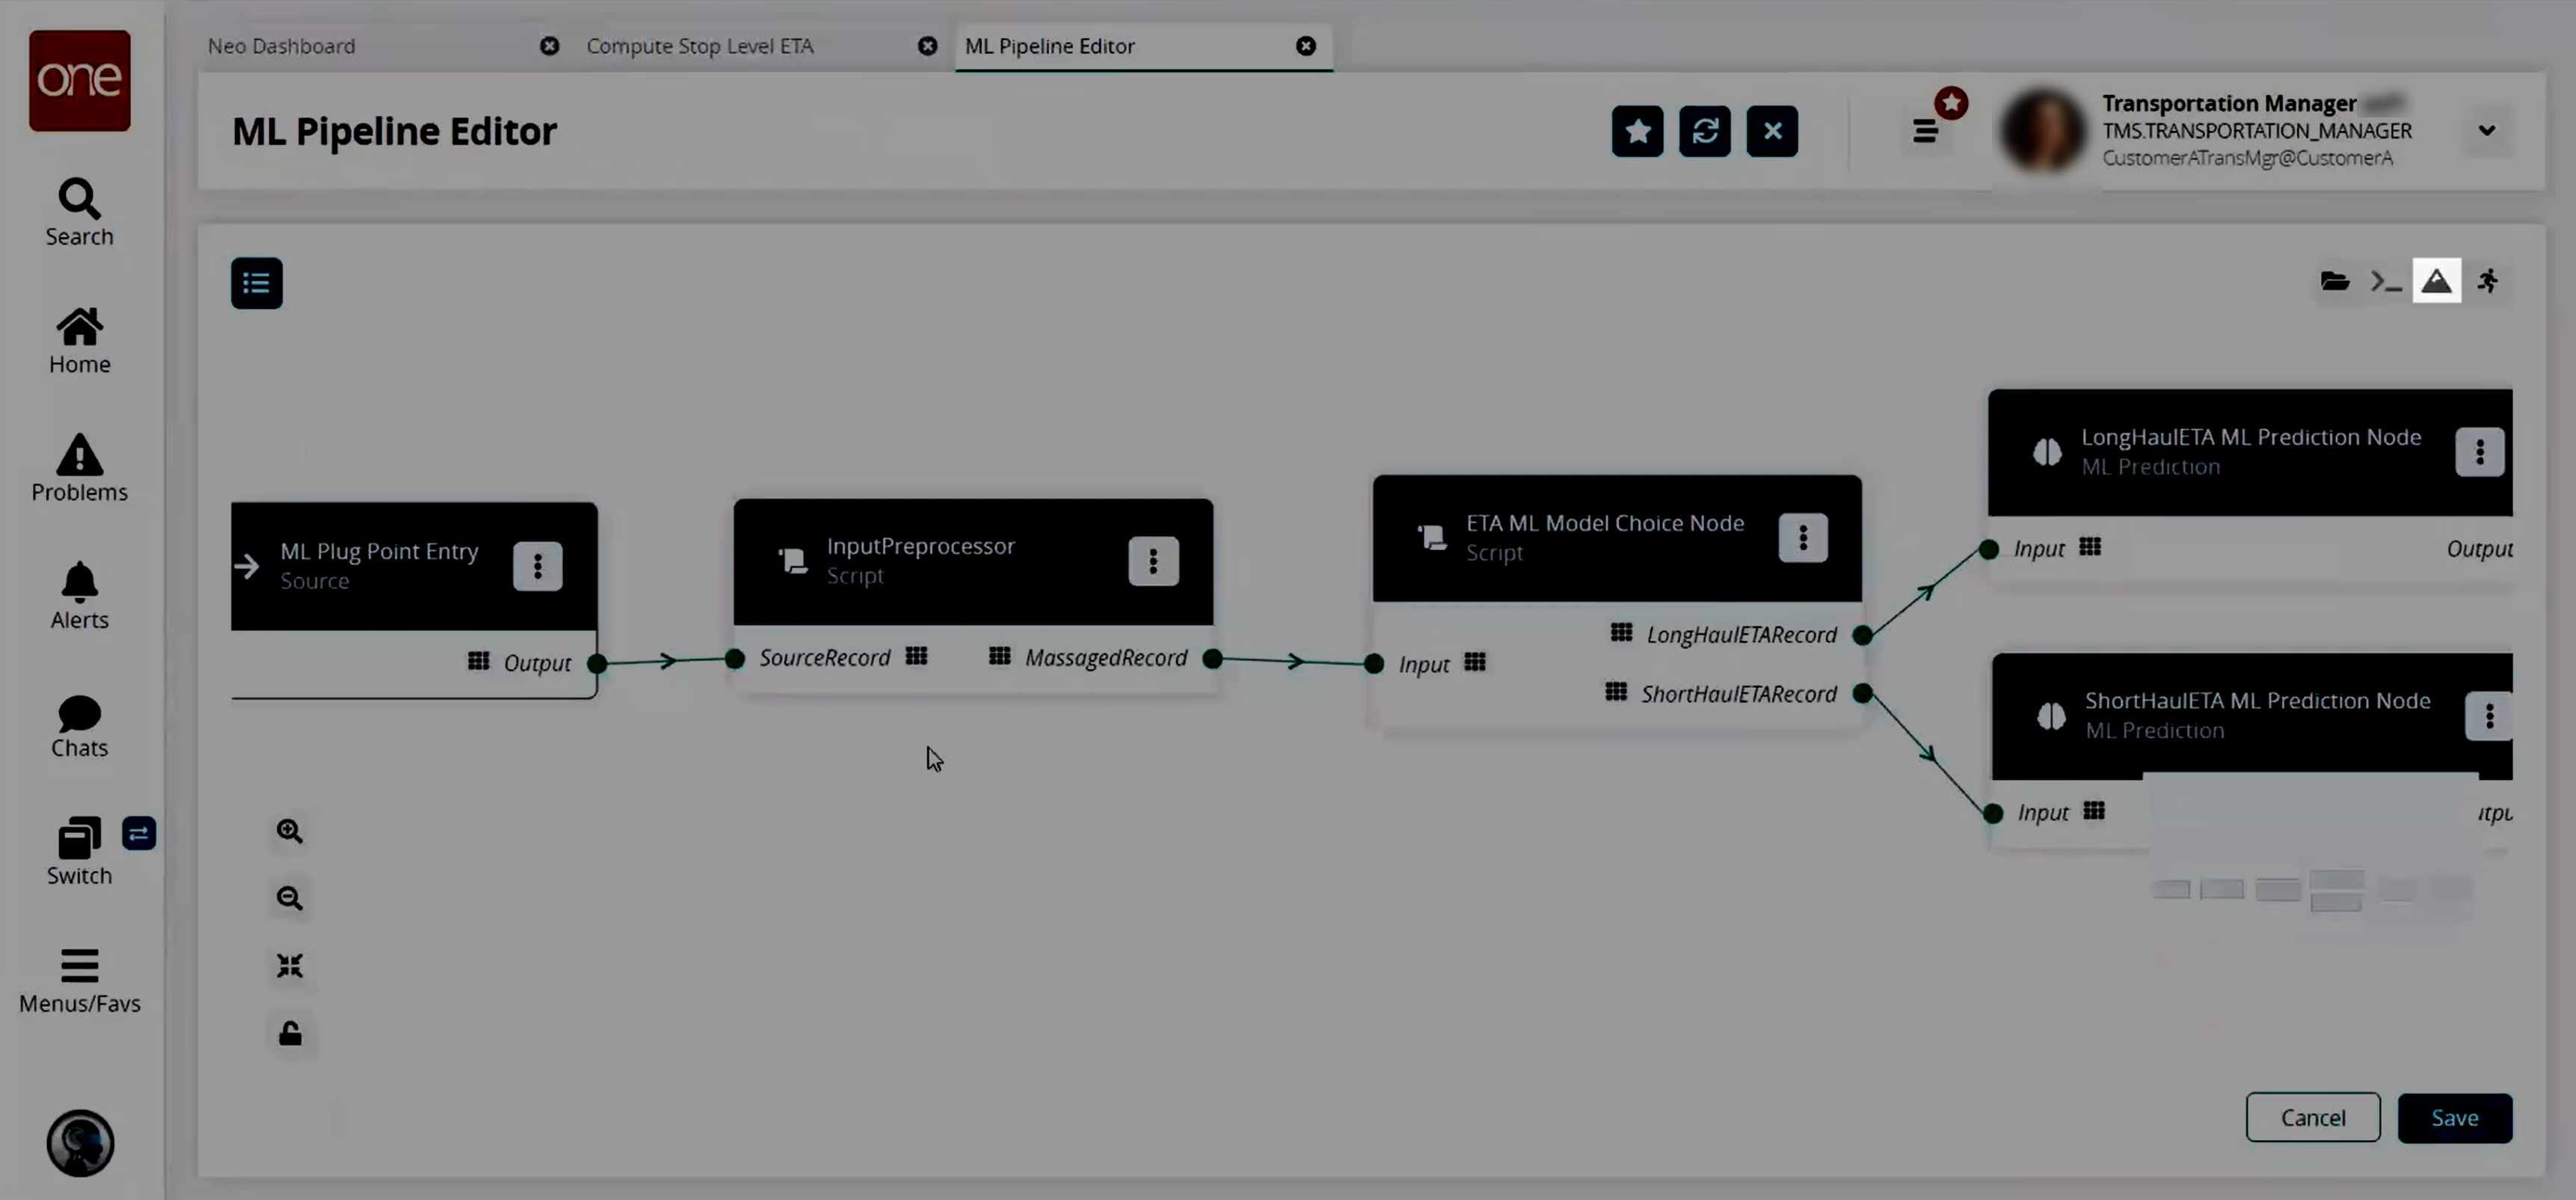
The ML Pipeline Editor screen appears in a new tab with an ML Plug Point Entry and an ML Plug Point Return displayed, as well as any other nodes that have been added to the pipeline.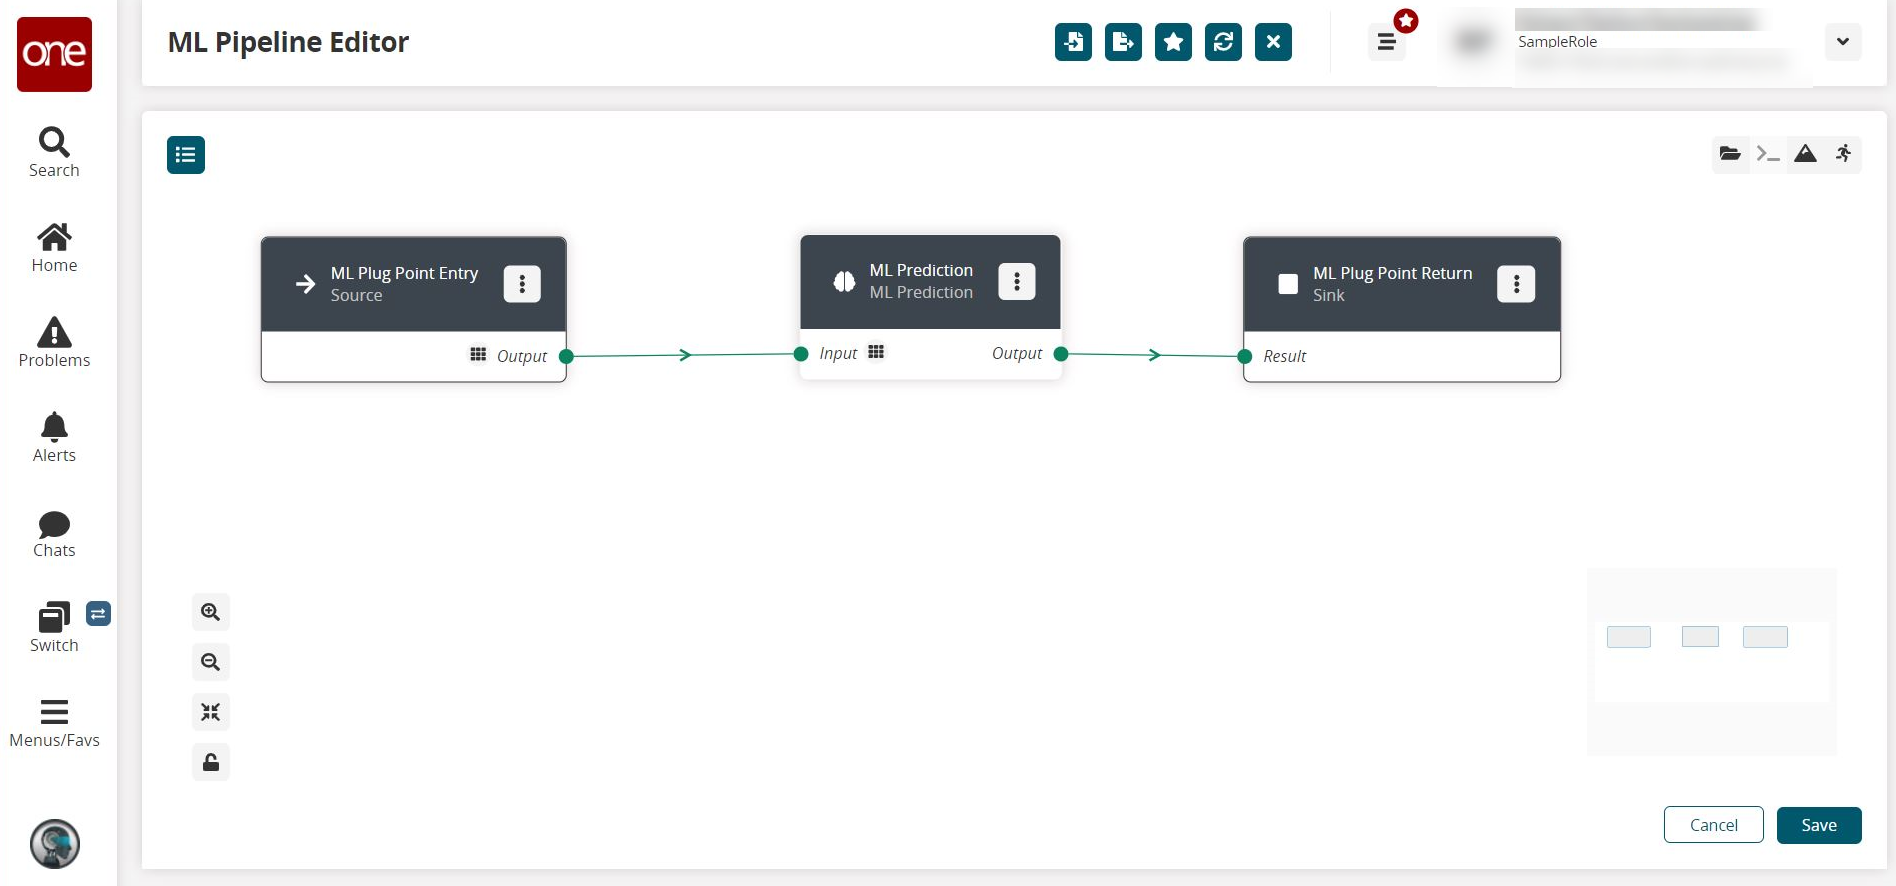
There are four types of nodes available.Source Node: All pipelines must have a source node. This node injects the data into the pipeline (the input of data).
Sink Node: All pipelines must have a sink node. This node extracts the resultant data from the pipeline (the output of data).
Script Node: This node performs a user-defined action on the data received from the previous node(s) in the pipeline.
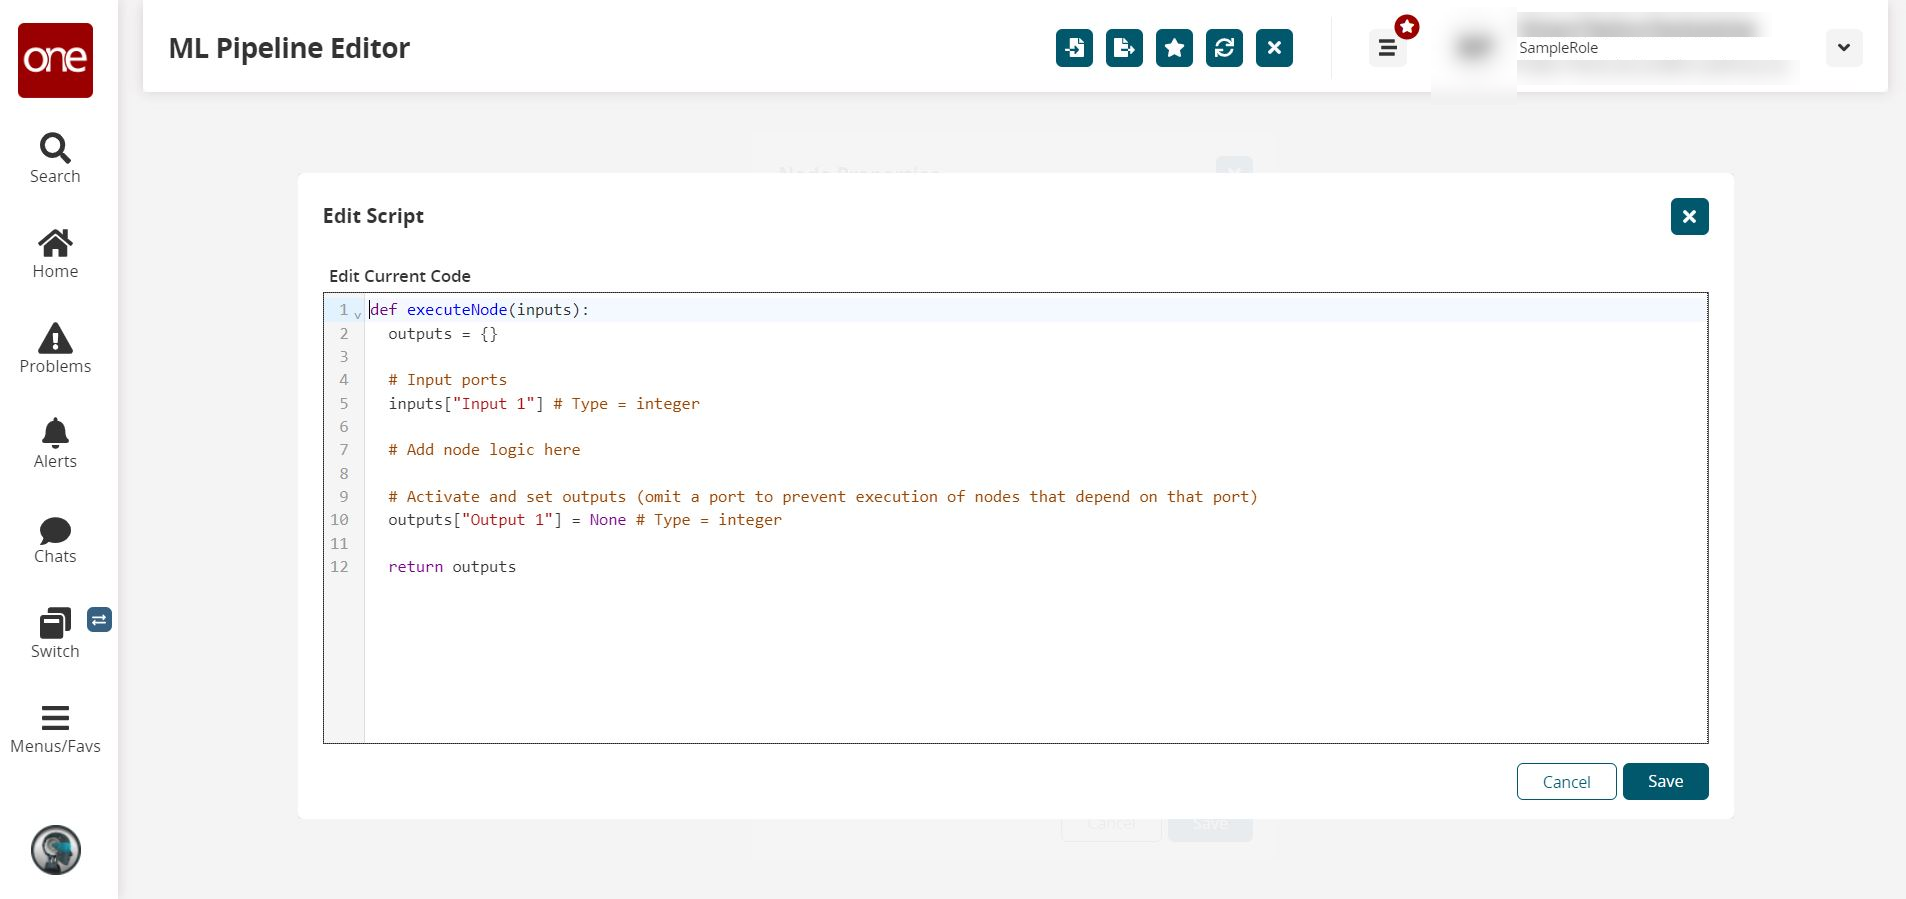
The script must contain "def executeNode(inputs):", which works as a hook point to call this script.
User can read the file(s) uploaded in the 'File Manager' using the path './{filenameWithExtension}'.
Prediction Node: This node takes the input data and uses the selected trained machine learning model to make the prediction.
Click the Node List icon.
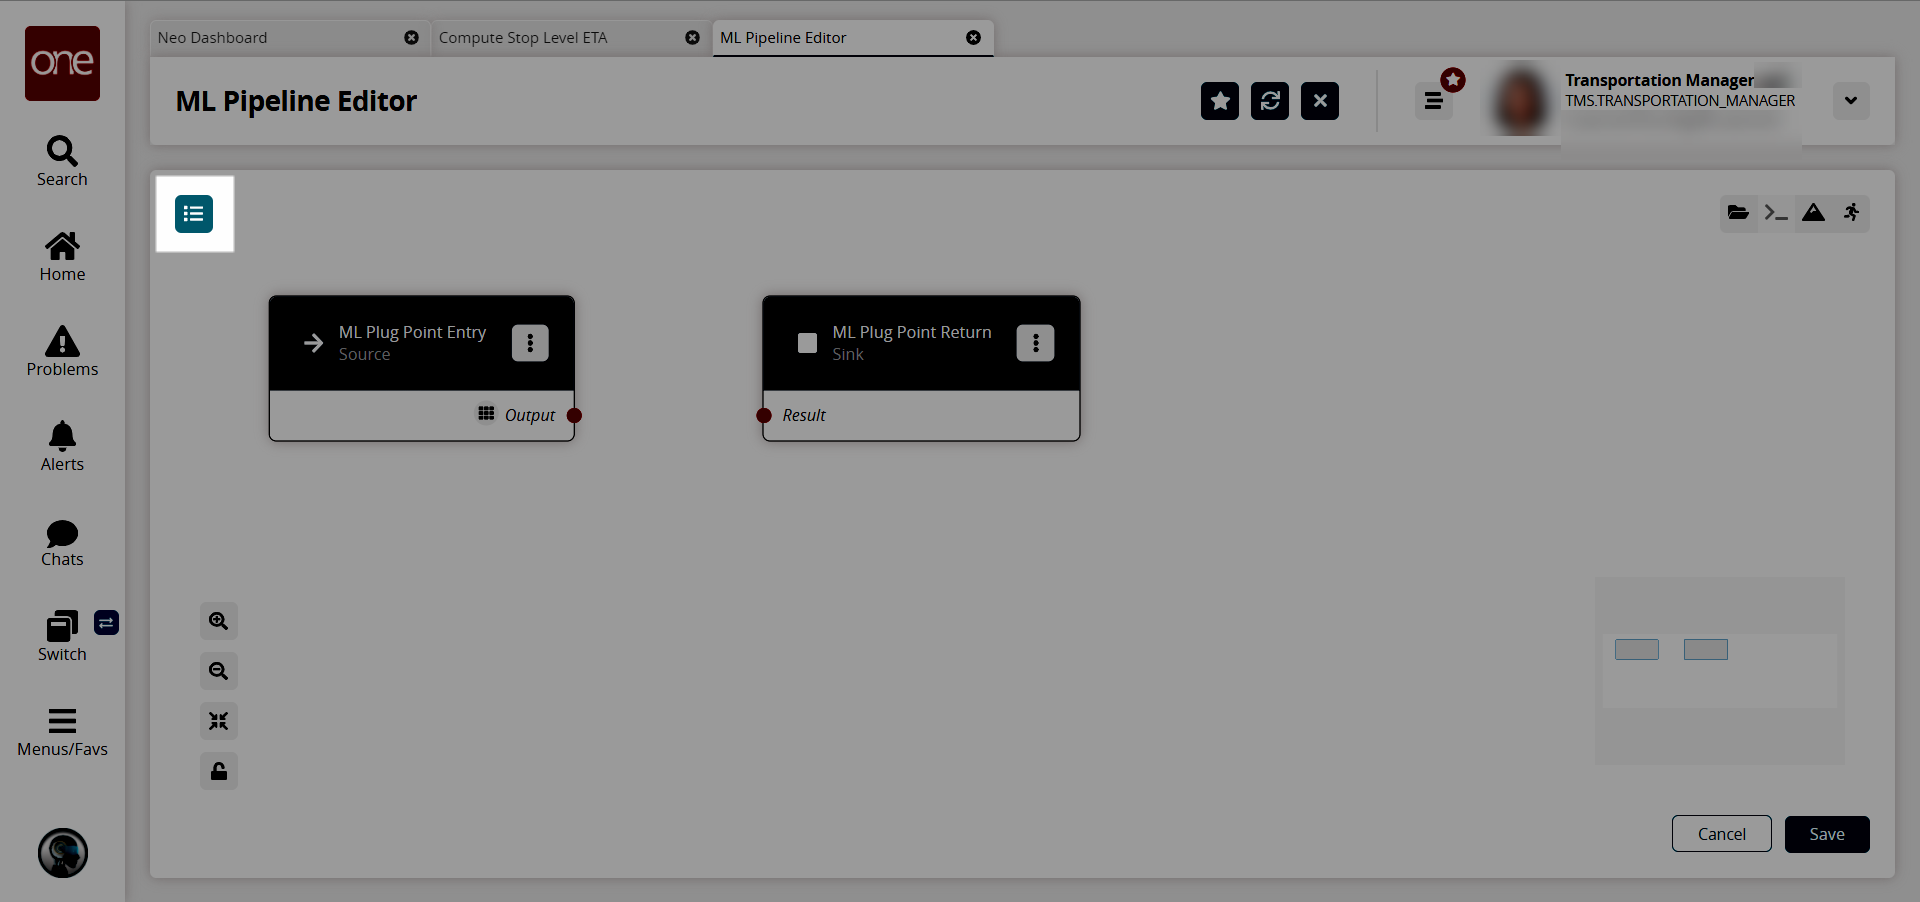
The Node List slideout appears.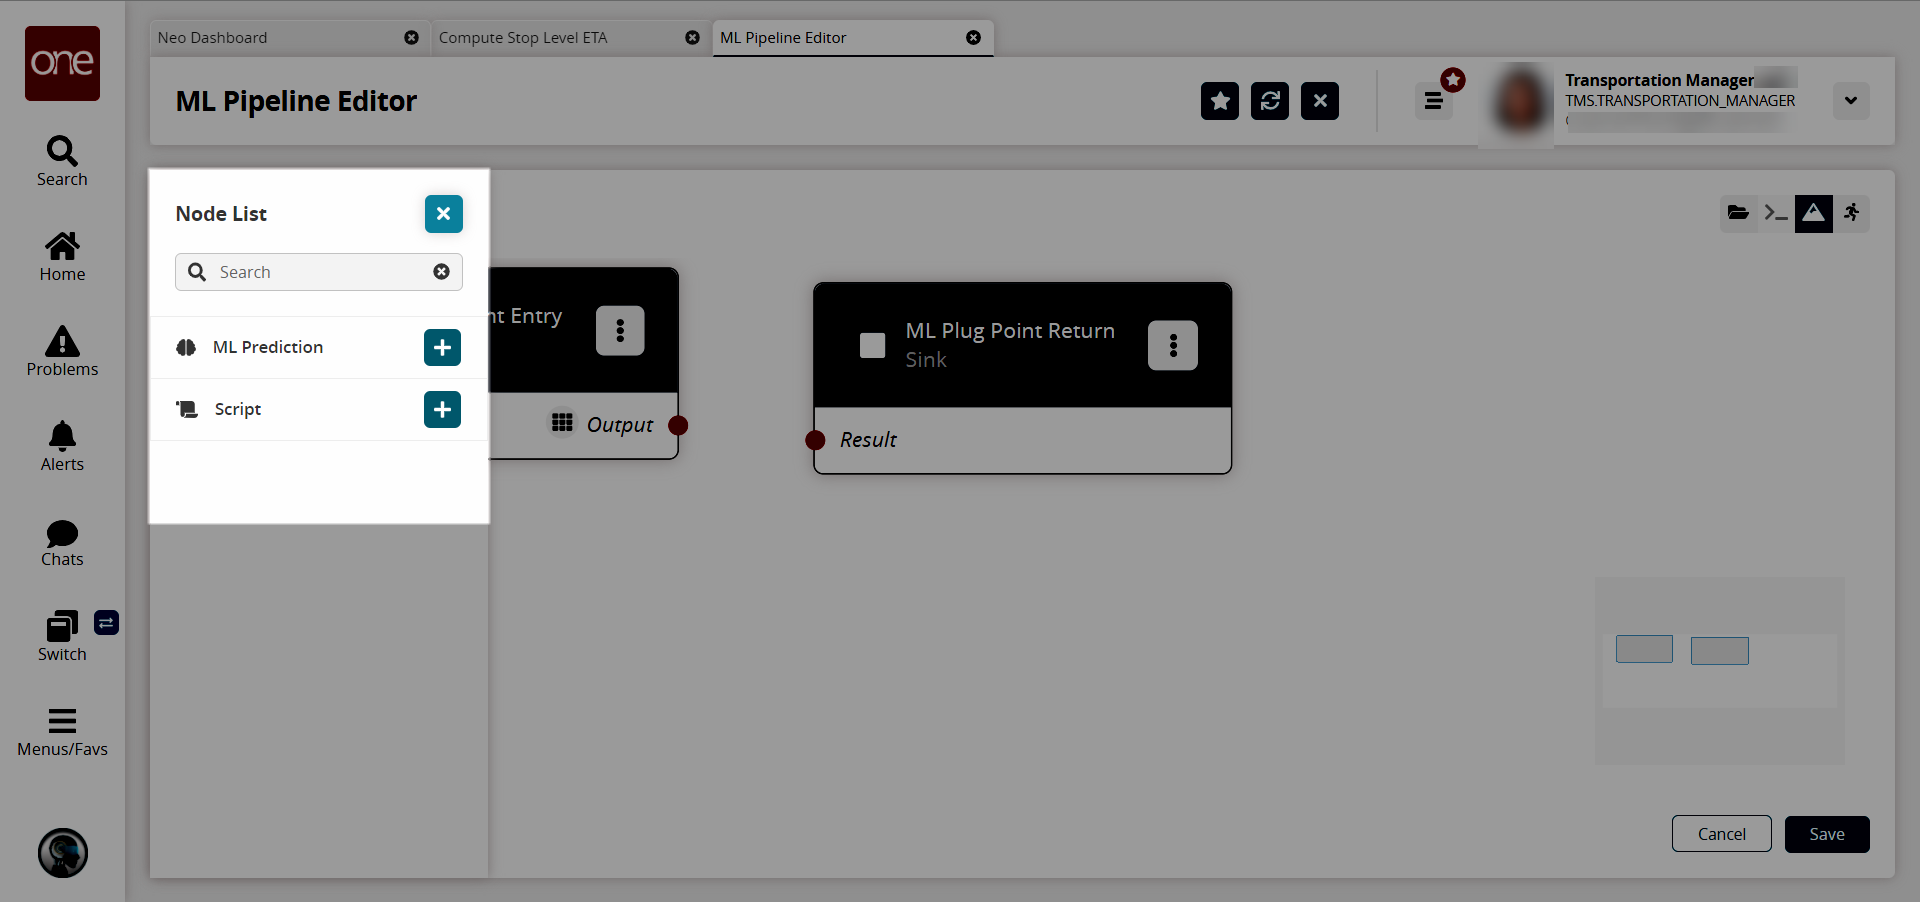
Adding a ML Prediction Node
Click the + (plus sign) icon for the node for ML Prediction.
The new node appears on the pipeline editor screen.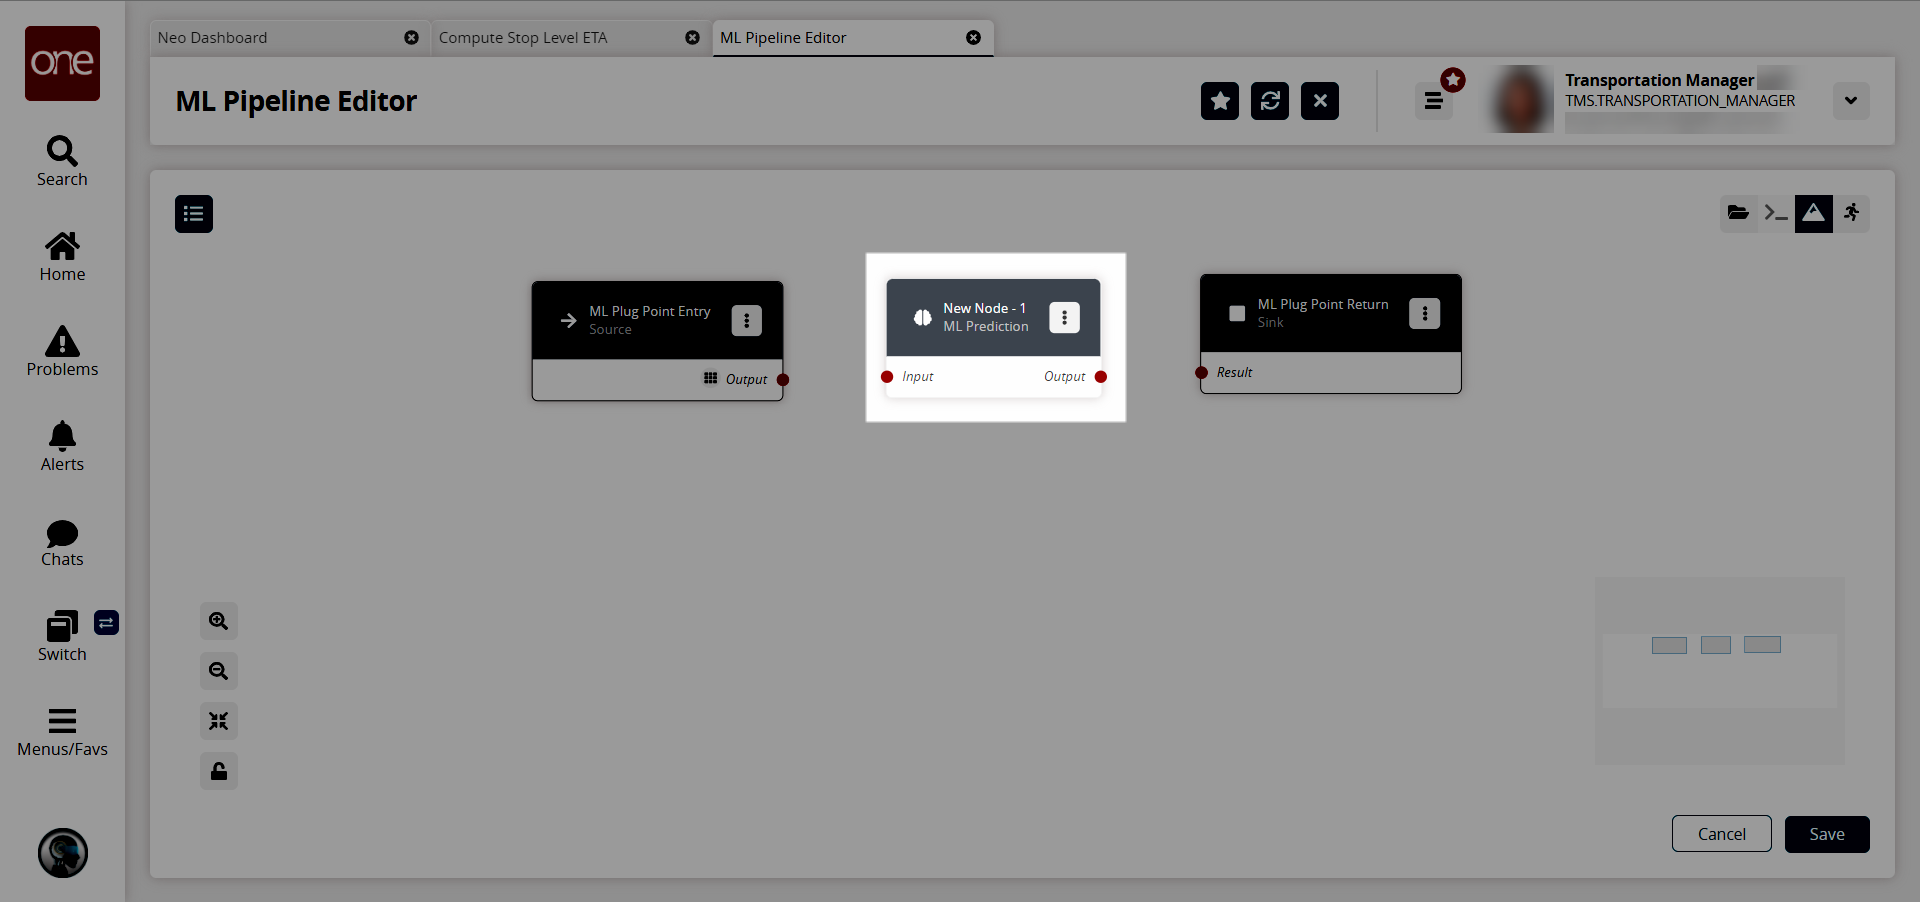
For each node, click the icon with three vertical dots and select Properties to configure that node.
The Node Properties popup window displays. These fields vary according to the node type chosen.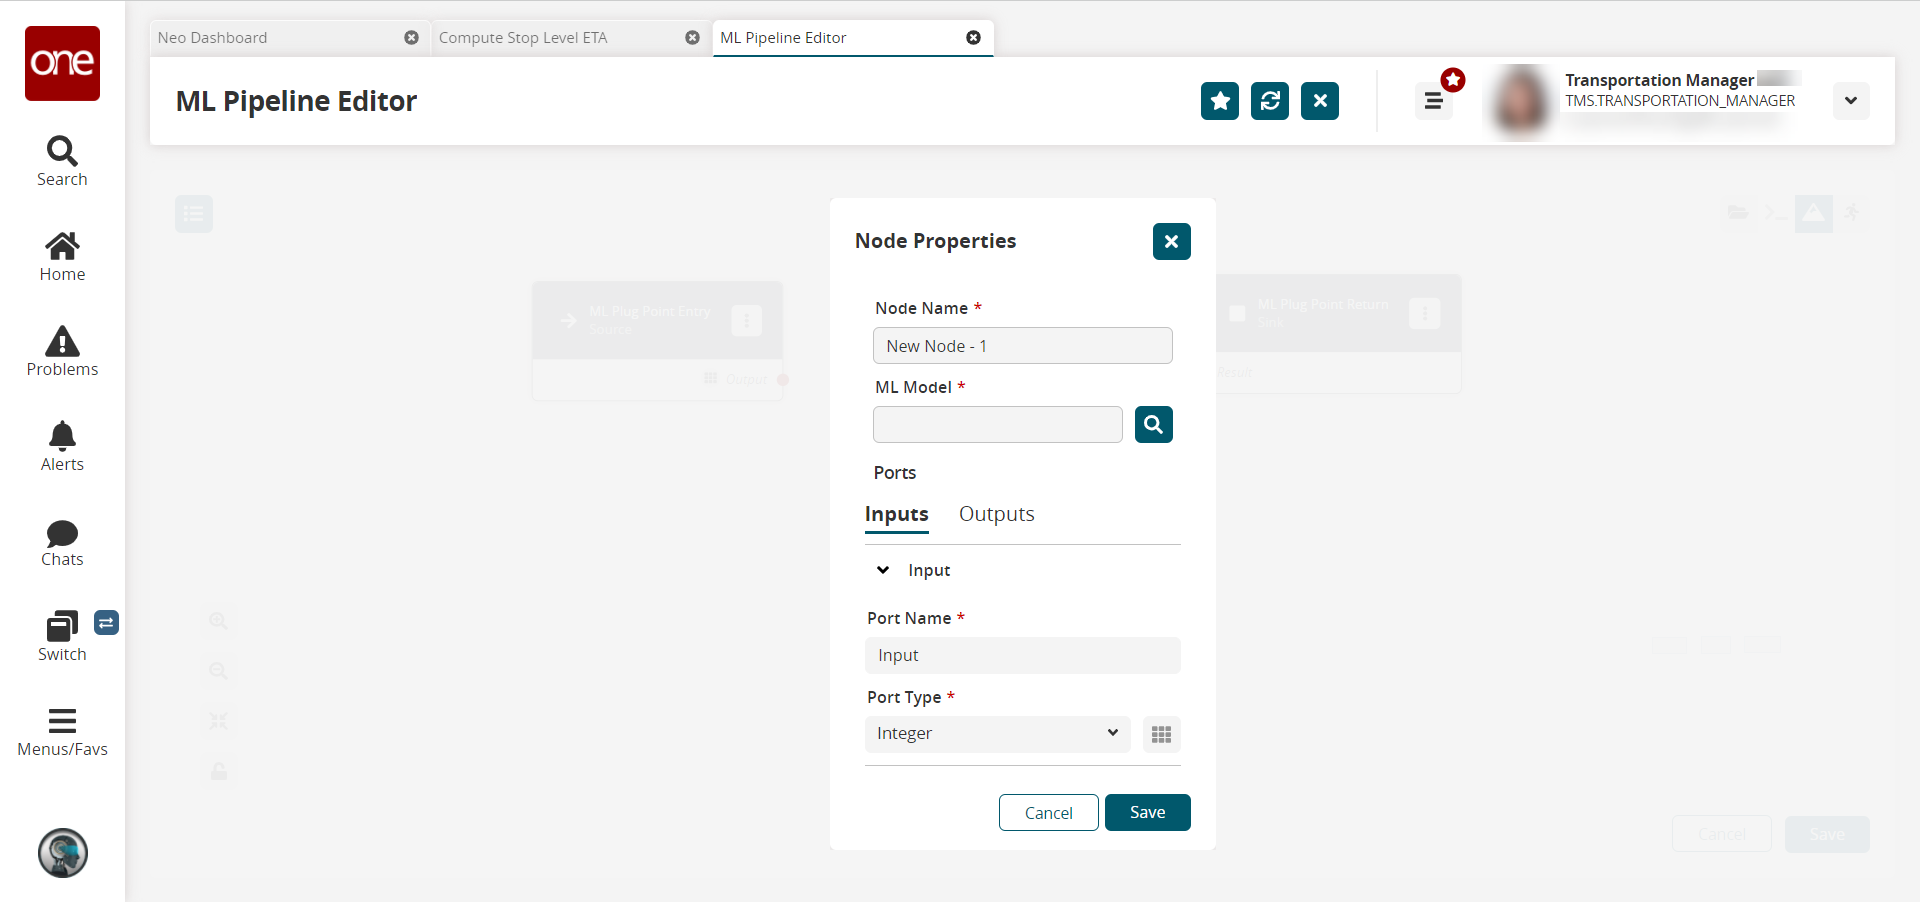
Complete the following fields. Fields with an asterisk ( * ) are required. Note that these fields vary according to the node type.
Tab
Field
Description
* Node Name
Enter a name for the node.
* ML Model
Click the search icon to select a machine learning (ML) model.
Inputs
* Port Name
Enter an input port name.
* Port Type
Select an input type from the dropdown list.
Outputs
* Port Name
Enter an output port name.
* Port Type
Select an output type from the dropdown list.
Click the Save button.
The ML Pipeline Editor screen reappears with the node properties updated.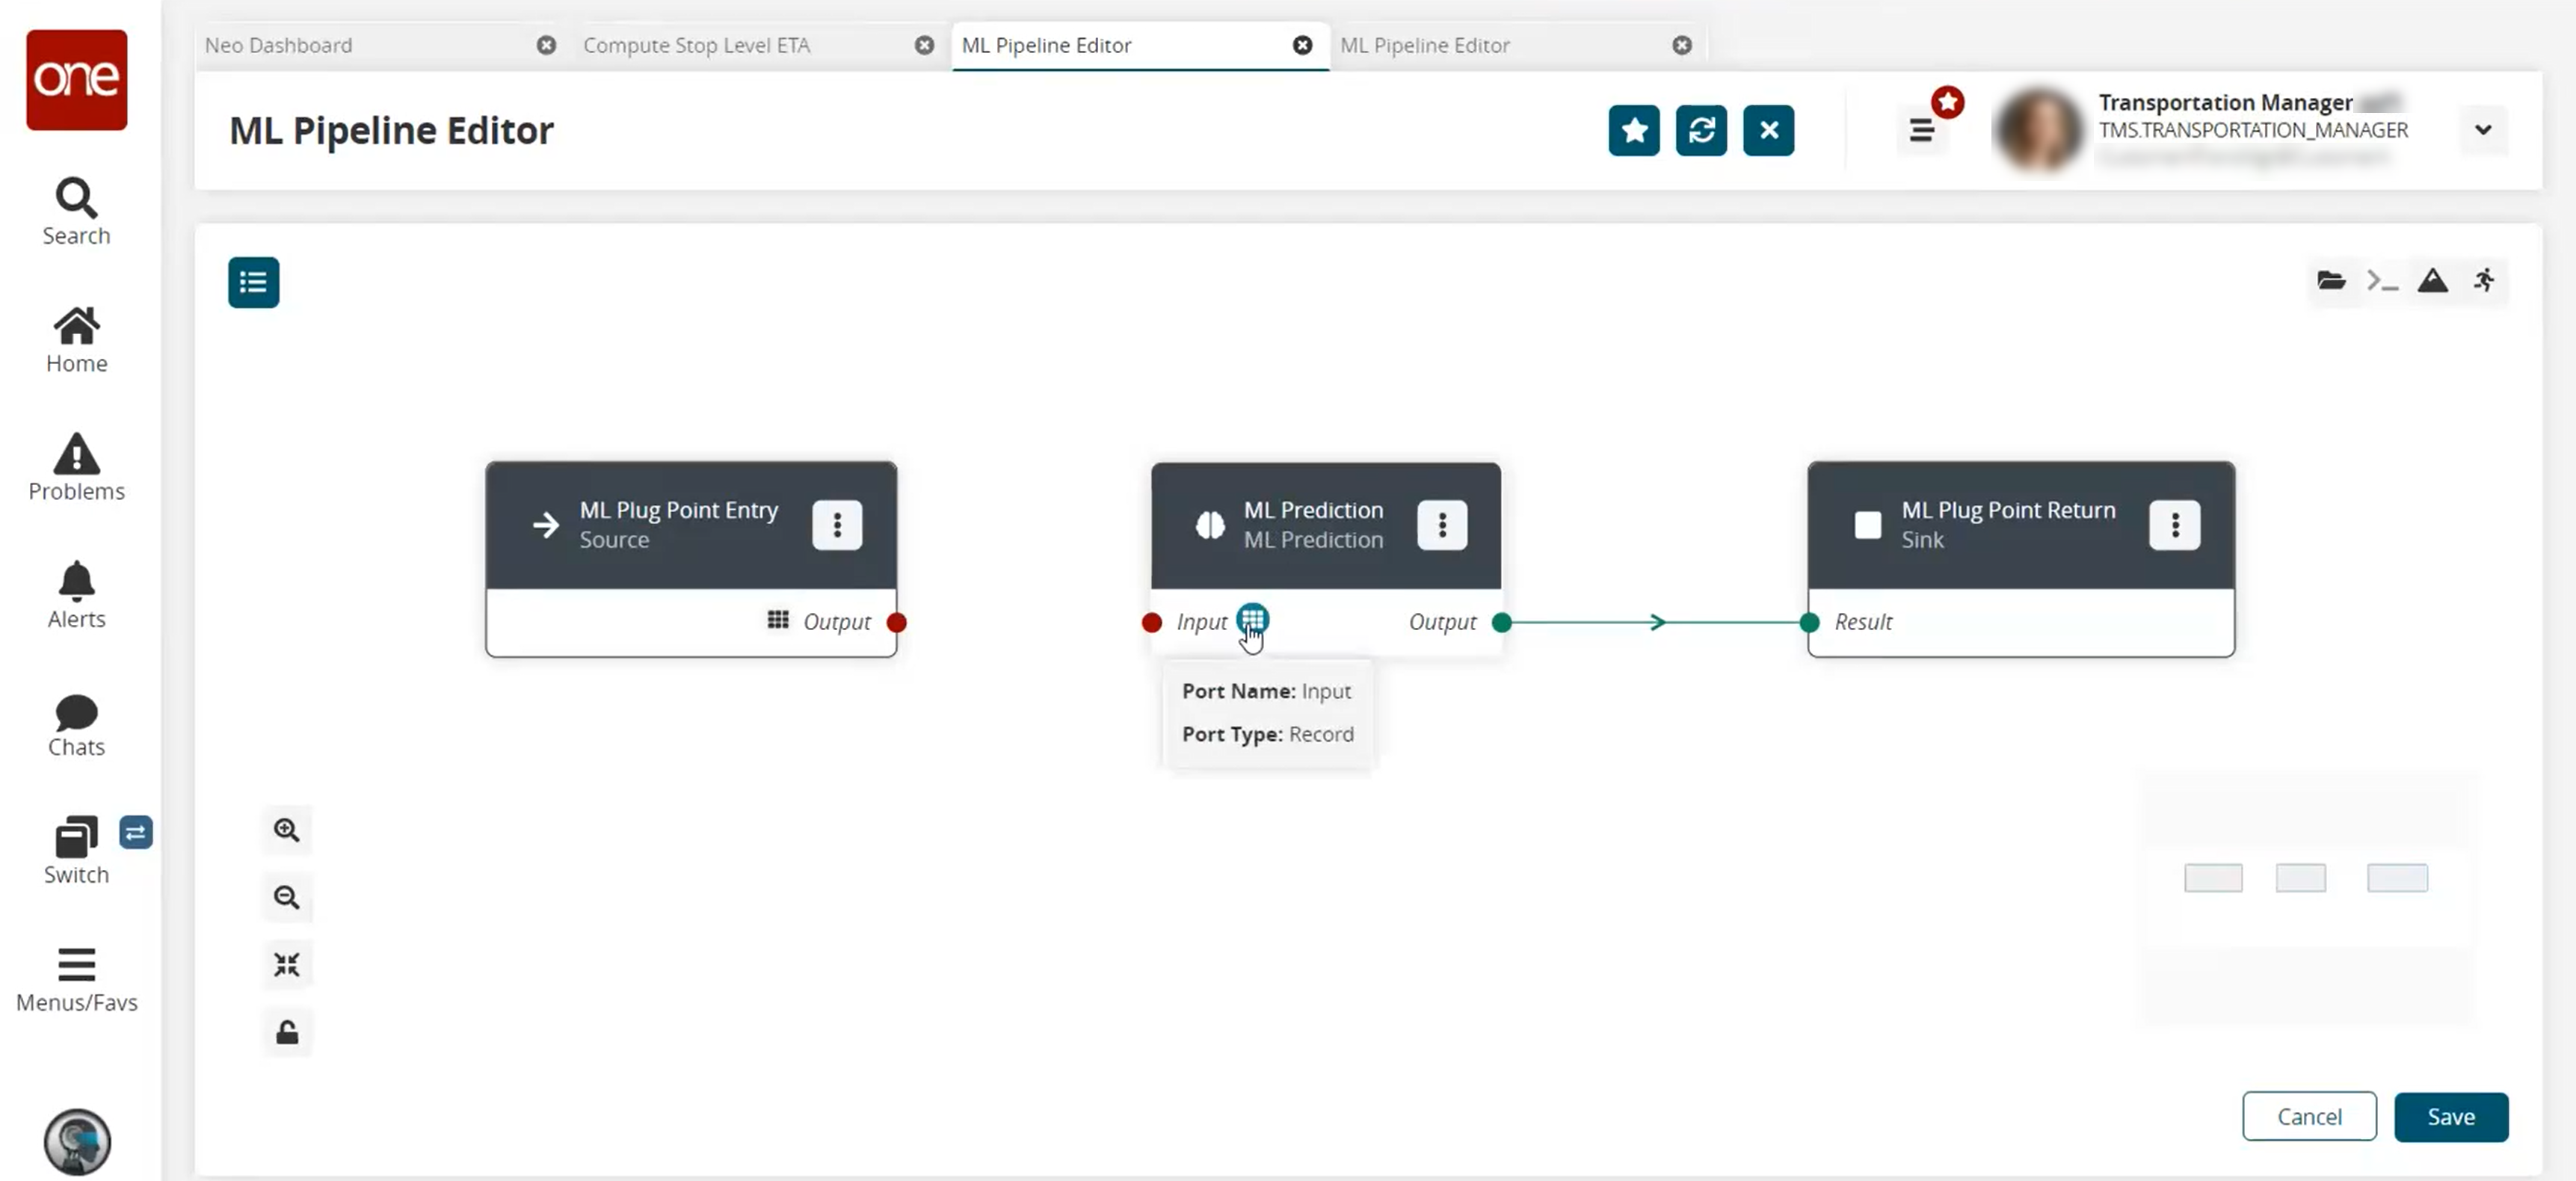
Repeat until all desired ML Prediction nodes are added.
Adding a Script Node
From the Node List slideout, click the + (plus) icon beside Script.
A new Script Node is added.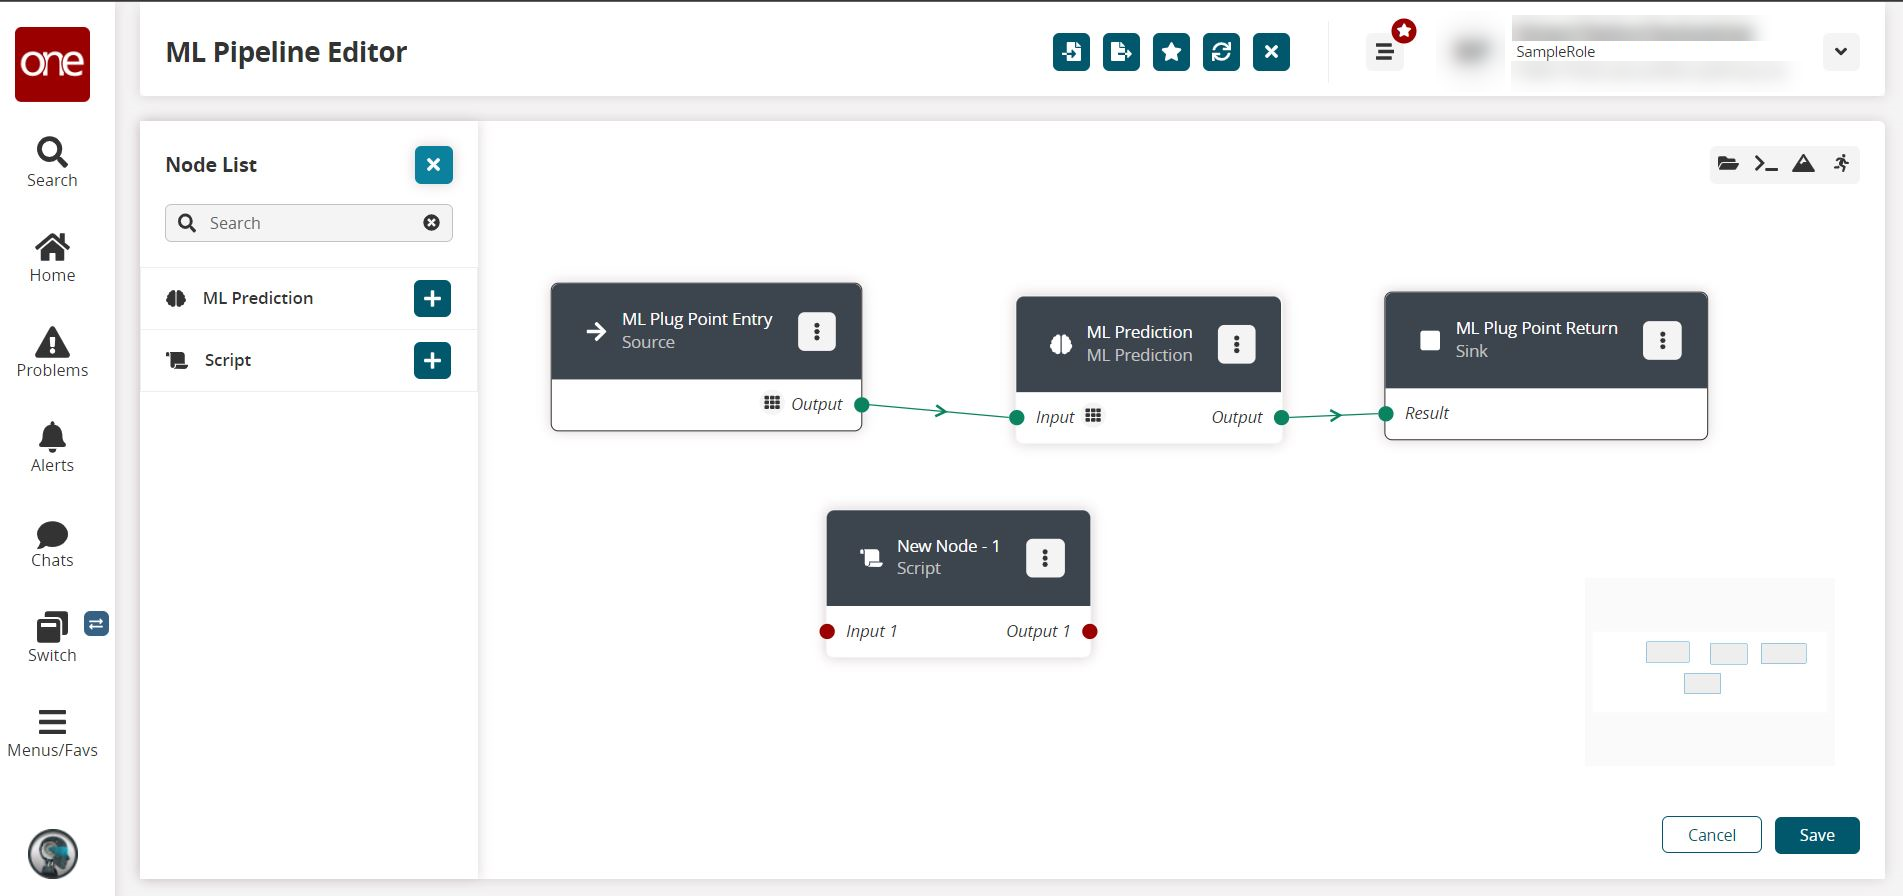
On the new script node, click the icon with three vertical dots and select Properties to configure that node.
The Node Properties popup window appears.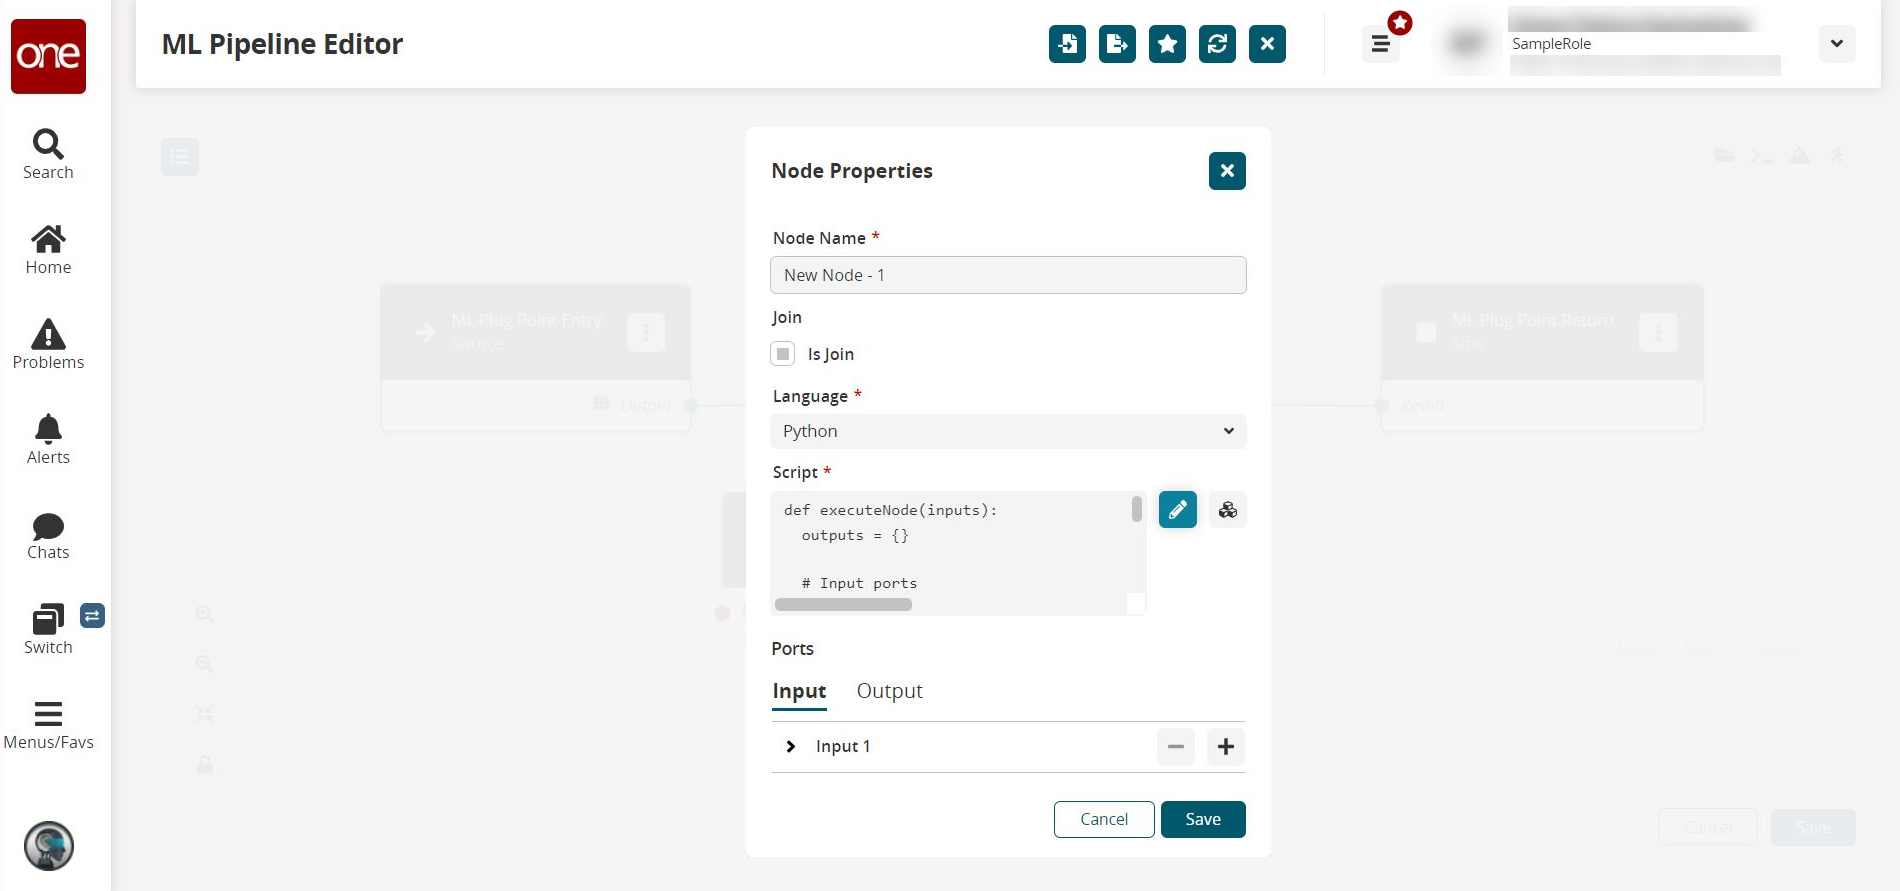
Complete the following fields. Fields with an asterisk ( * ) are required.
Field
Description
* Node Name
Enter a name for this node.
Is Join
Select to indicate this node acts as a merging point for multiple arcs. This node will be executed even if any of the input arcs(s) are executed successfully.
* Language
Select the programming language from the dropdown list.
* Script
Click the pencil icon to edit the script. See the next step for more information.
Input tab (in Ports section)
Click the plus and minus icons to add and remove input ports.
Output tab (in Ports section)
Click the plus and minus icons to add and remove output ports.
If desired, click the pencil icon in the Script field, and the Edit Script popup window displays. Edit the current code and click Save when finished.
Repeat the process until all script nodes are added.
If a file needs to be uploaded for a script node, click the file folder icon in the top right.
The File Manager slideout displays.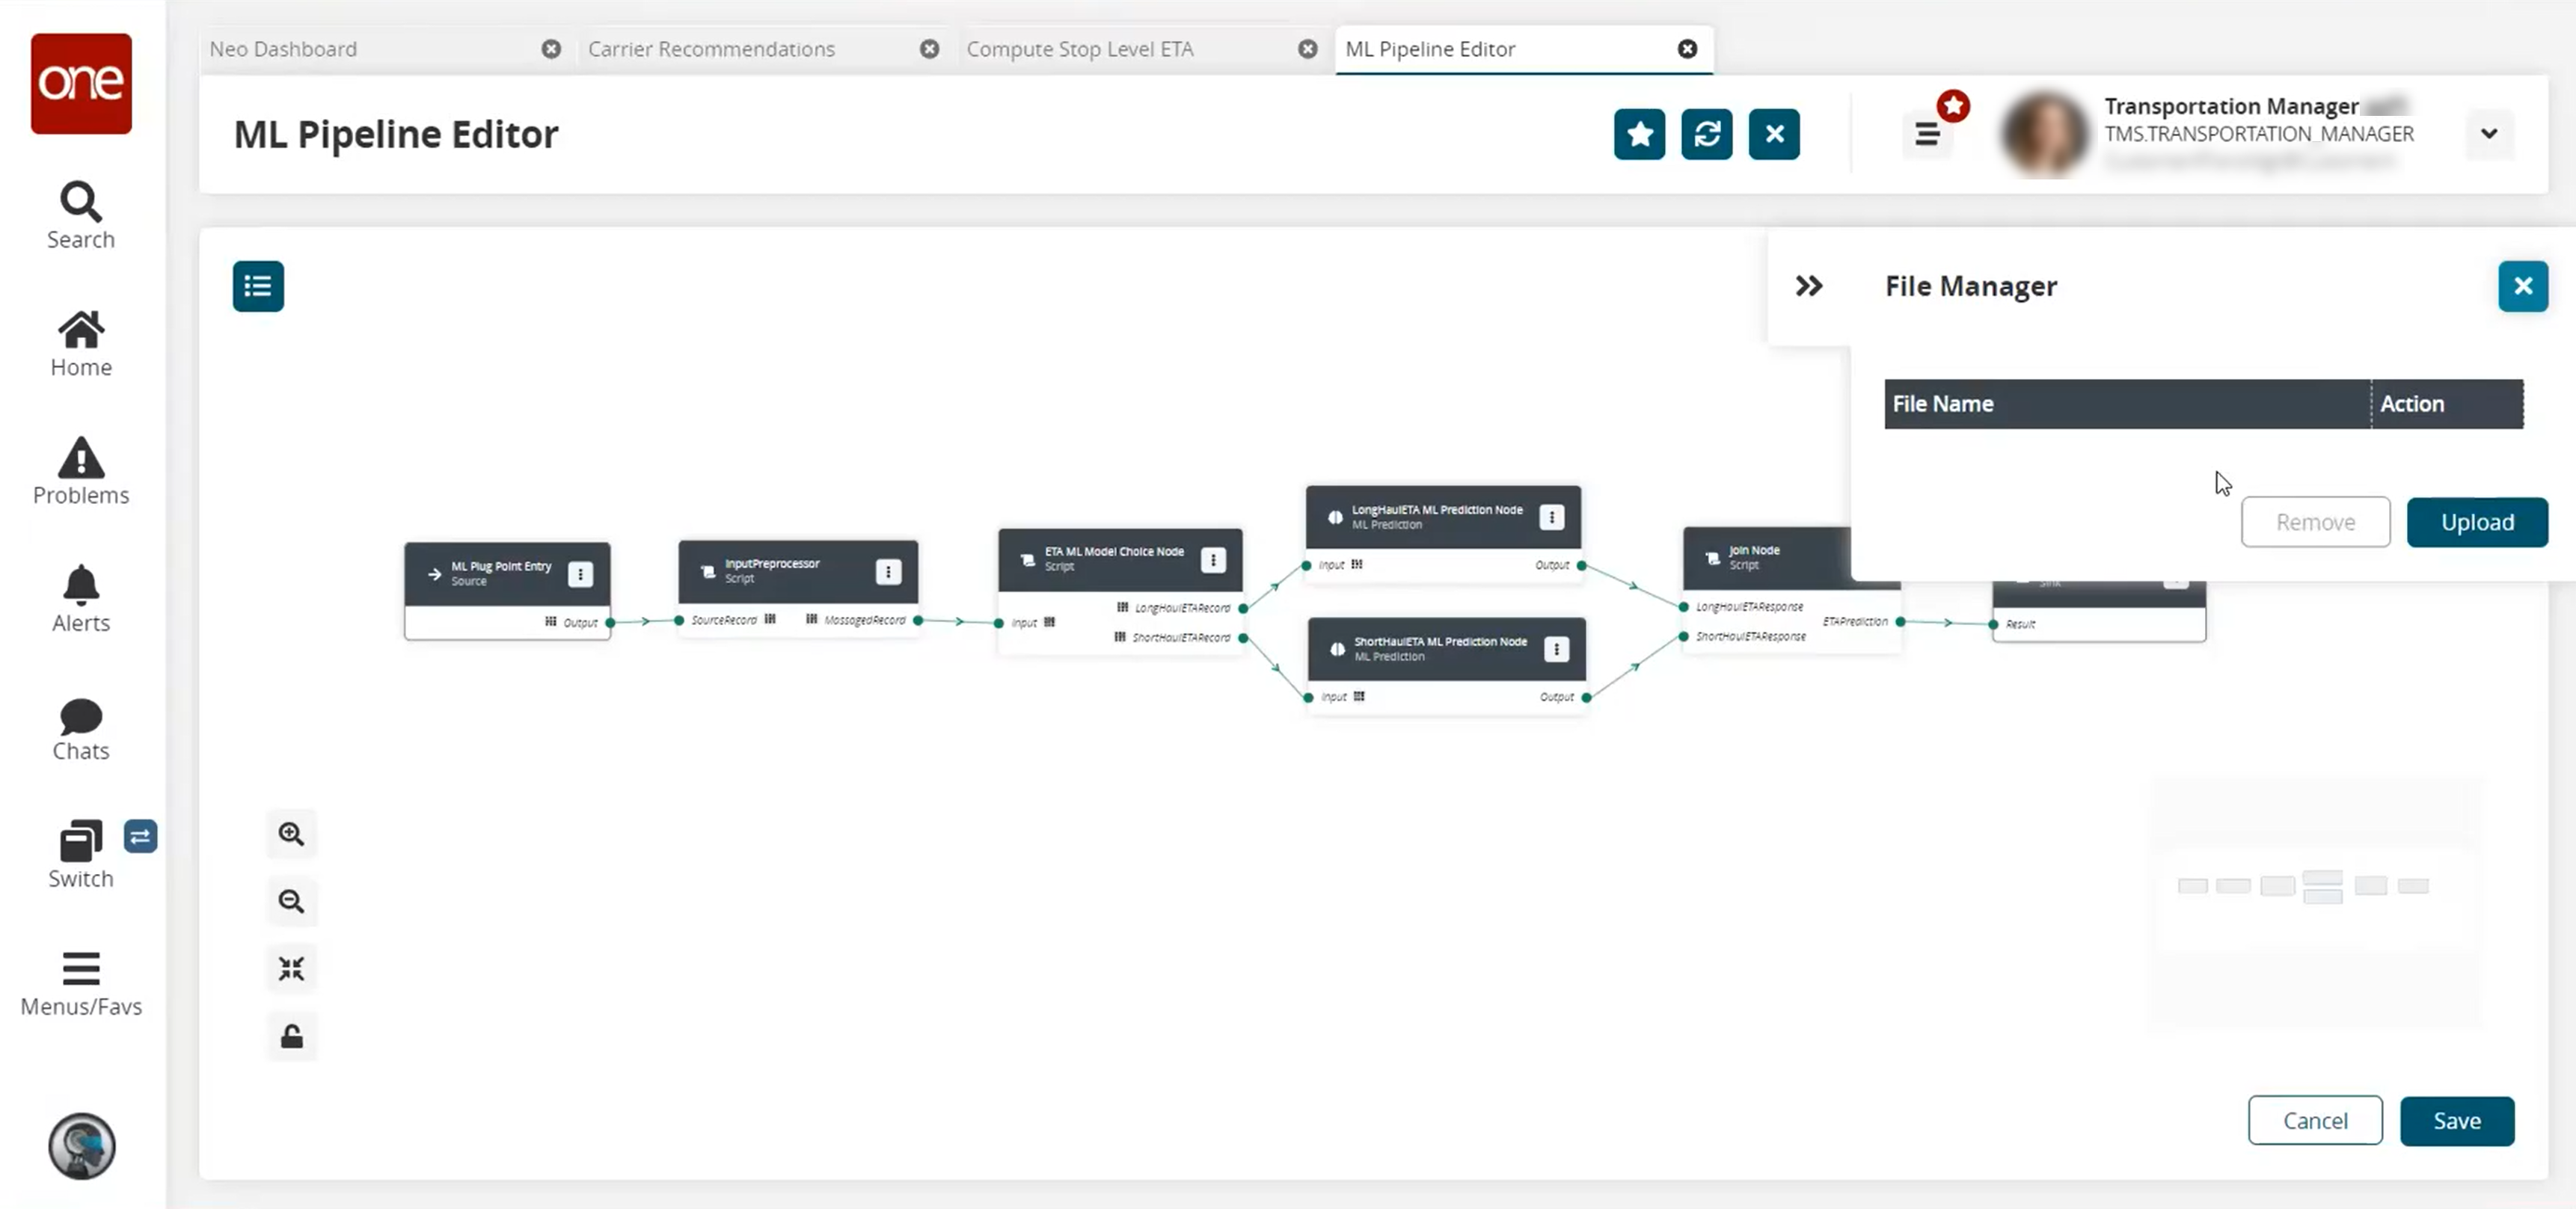
Testing the ML Pipeline
Once all nodes are added, click the icon in the top right corner to enter values to run a test of the ML pipeline.
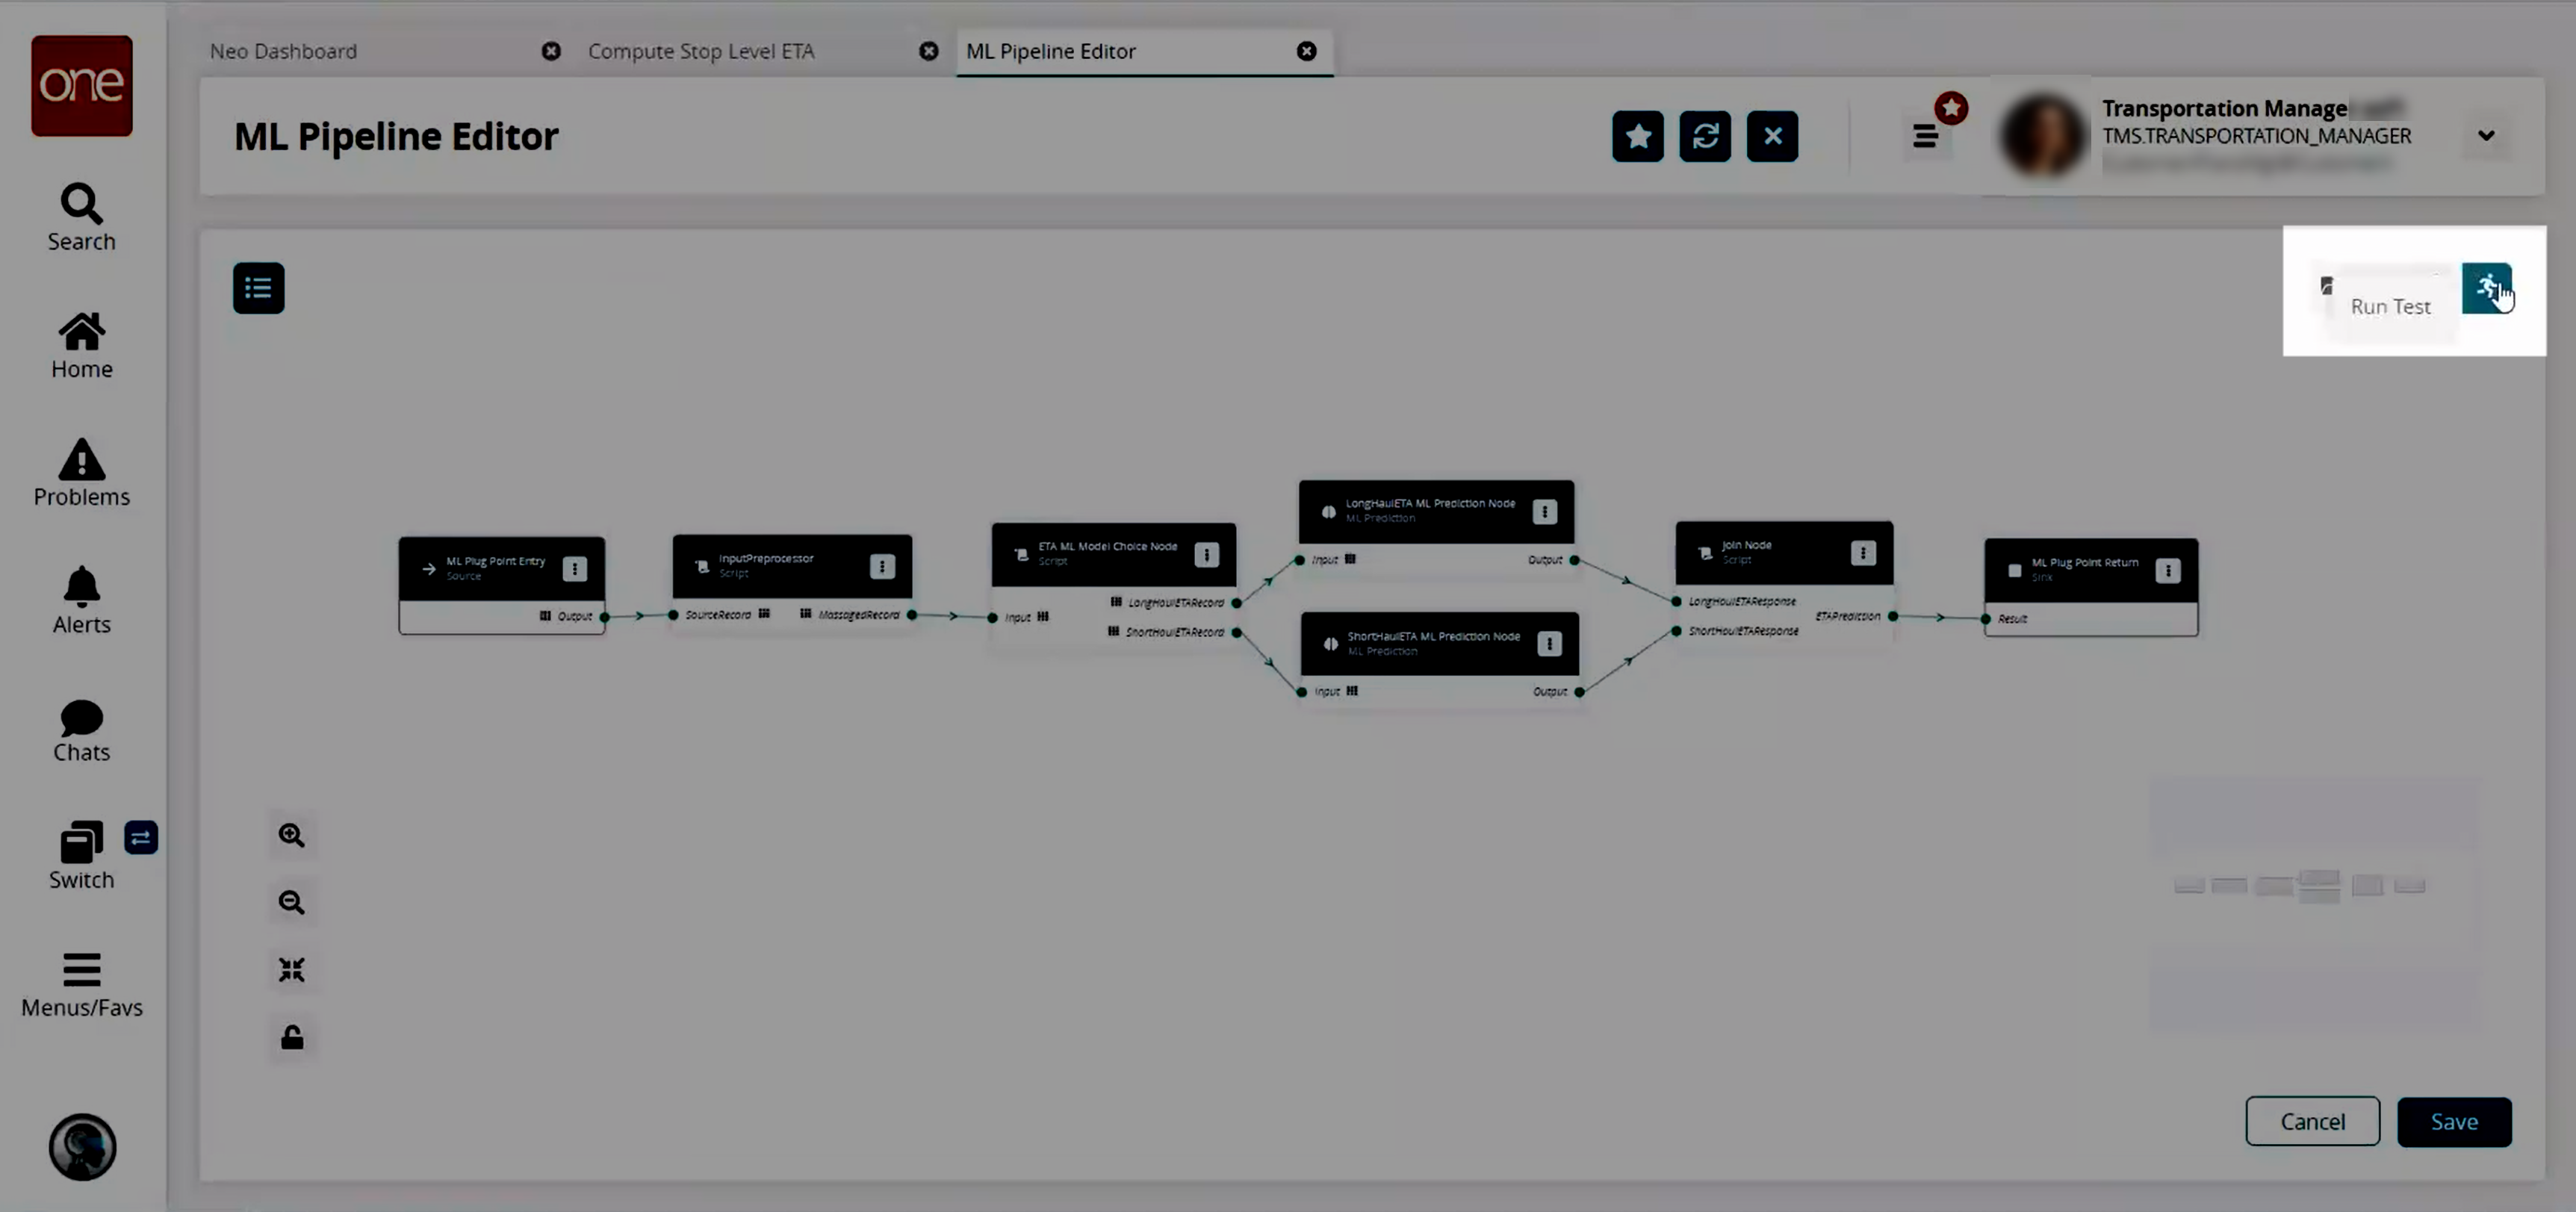
The Test Run Pipeline slideout displays.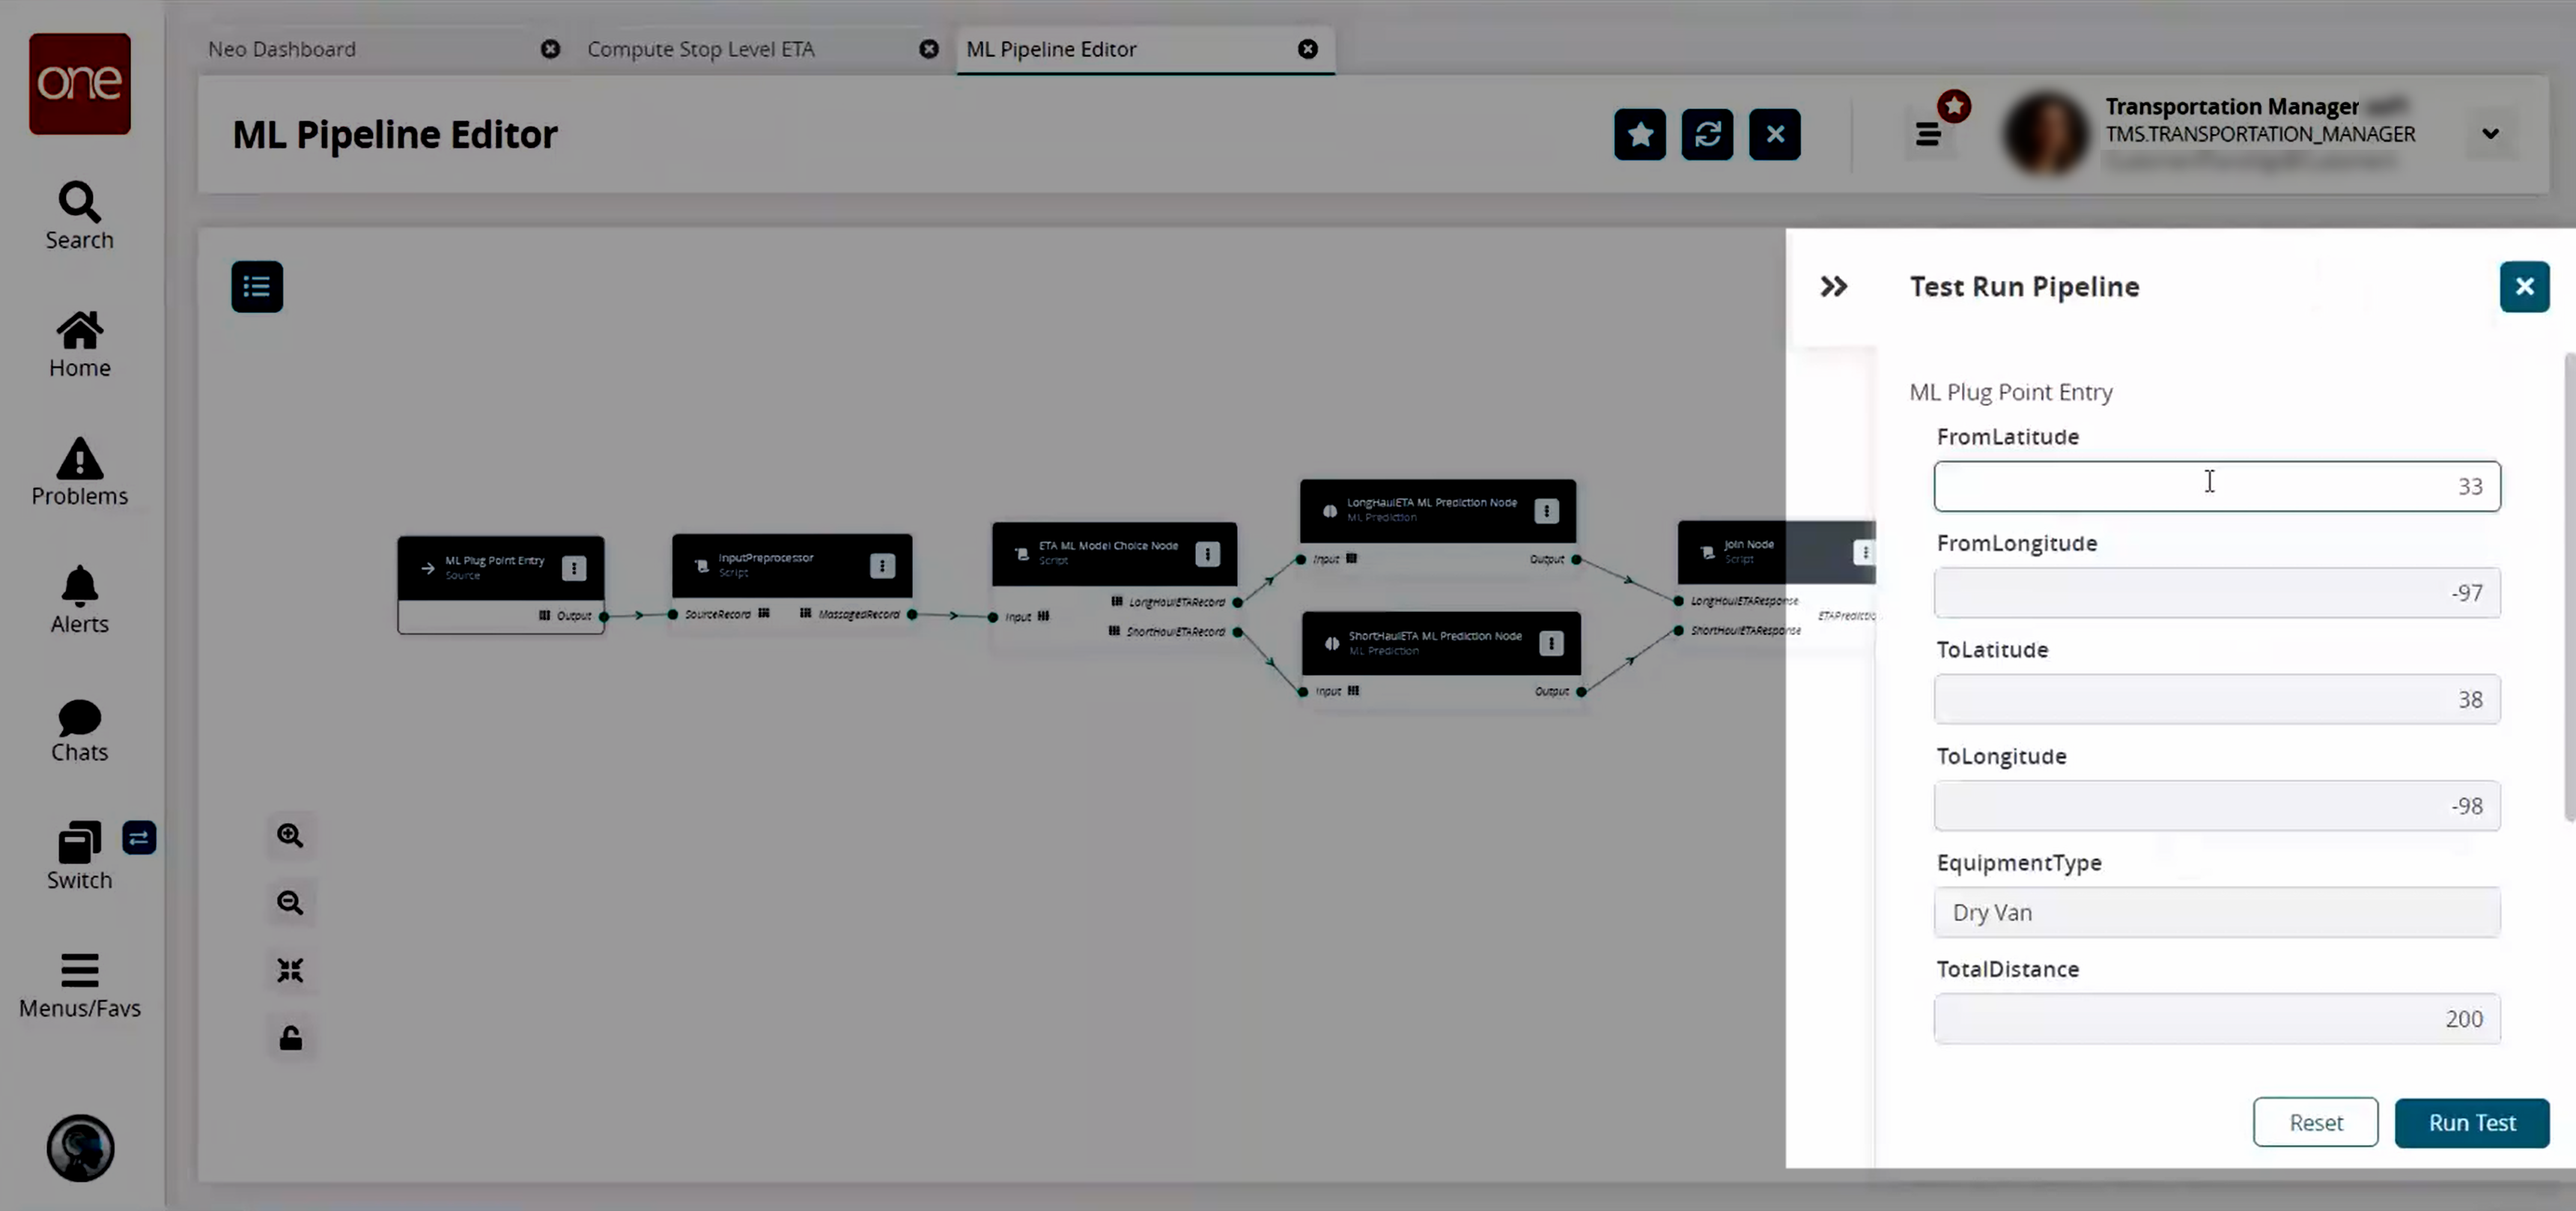
Enter test data for any field desired.
Click the Run Test button.
The test results appear on the ML Pipeline Editor page. Note that the results shown will depend on the test data used.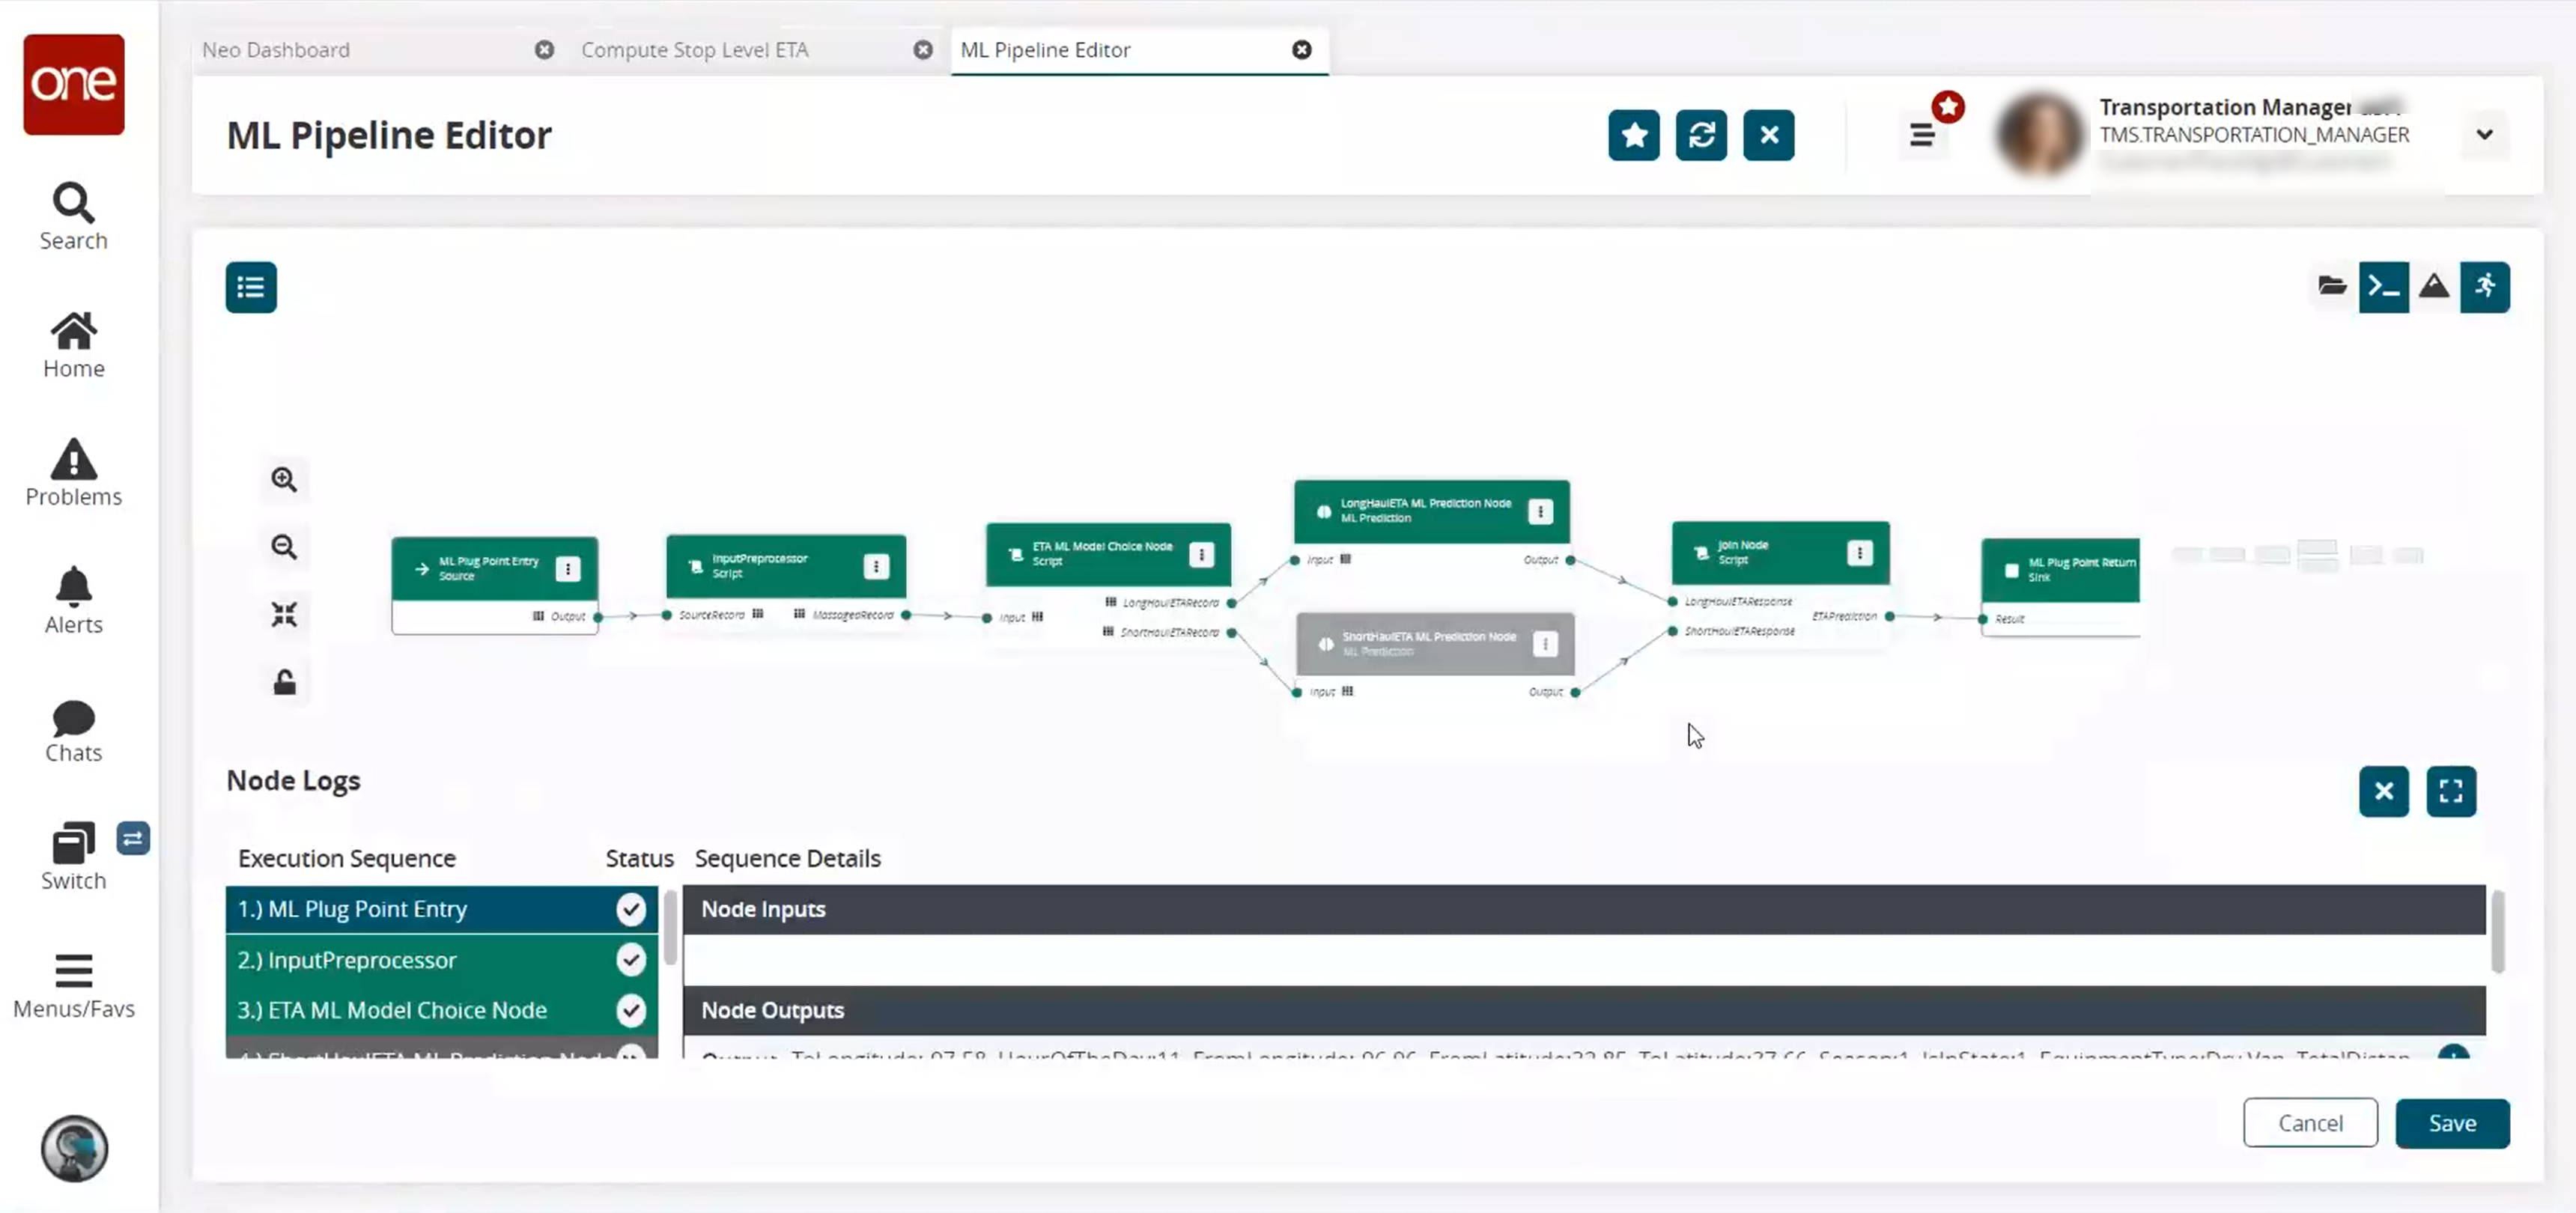
In the Execution Sequence column in the Node Logs section, click any node to see the detailed results from the test on that node.
The Node Inputs, Node Outputs, and Node Log display.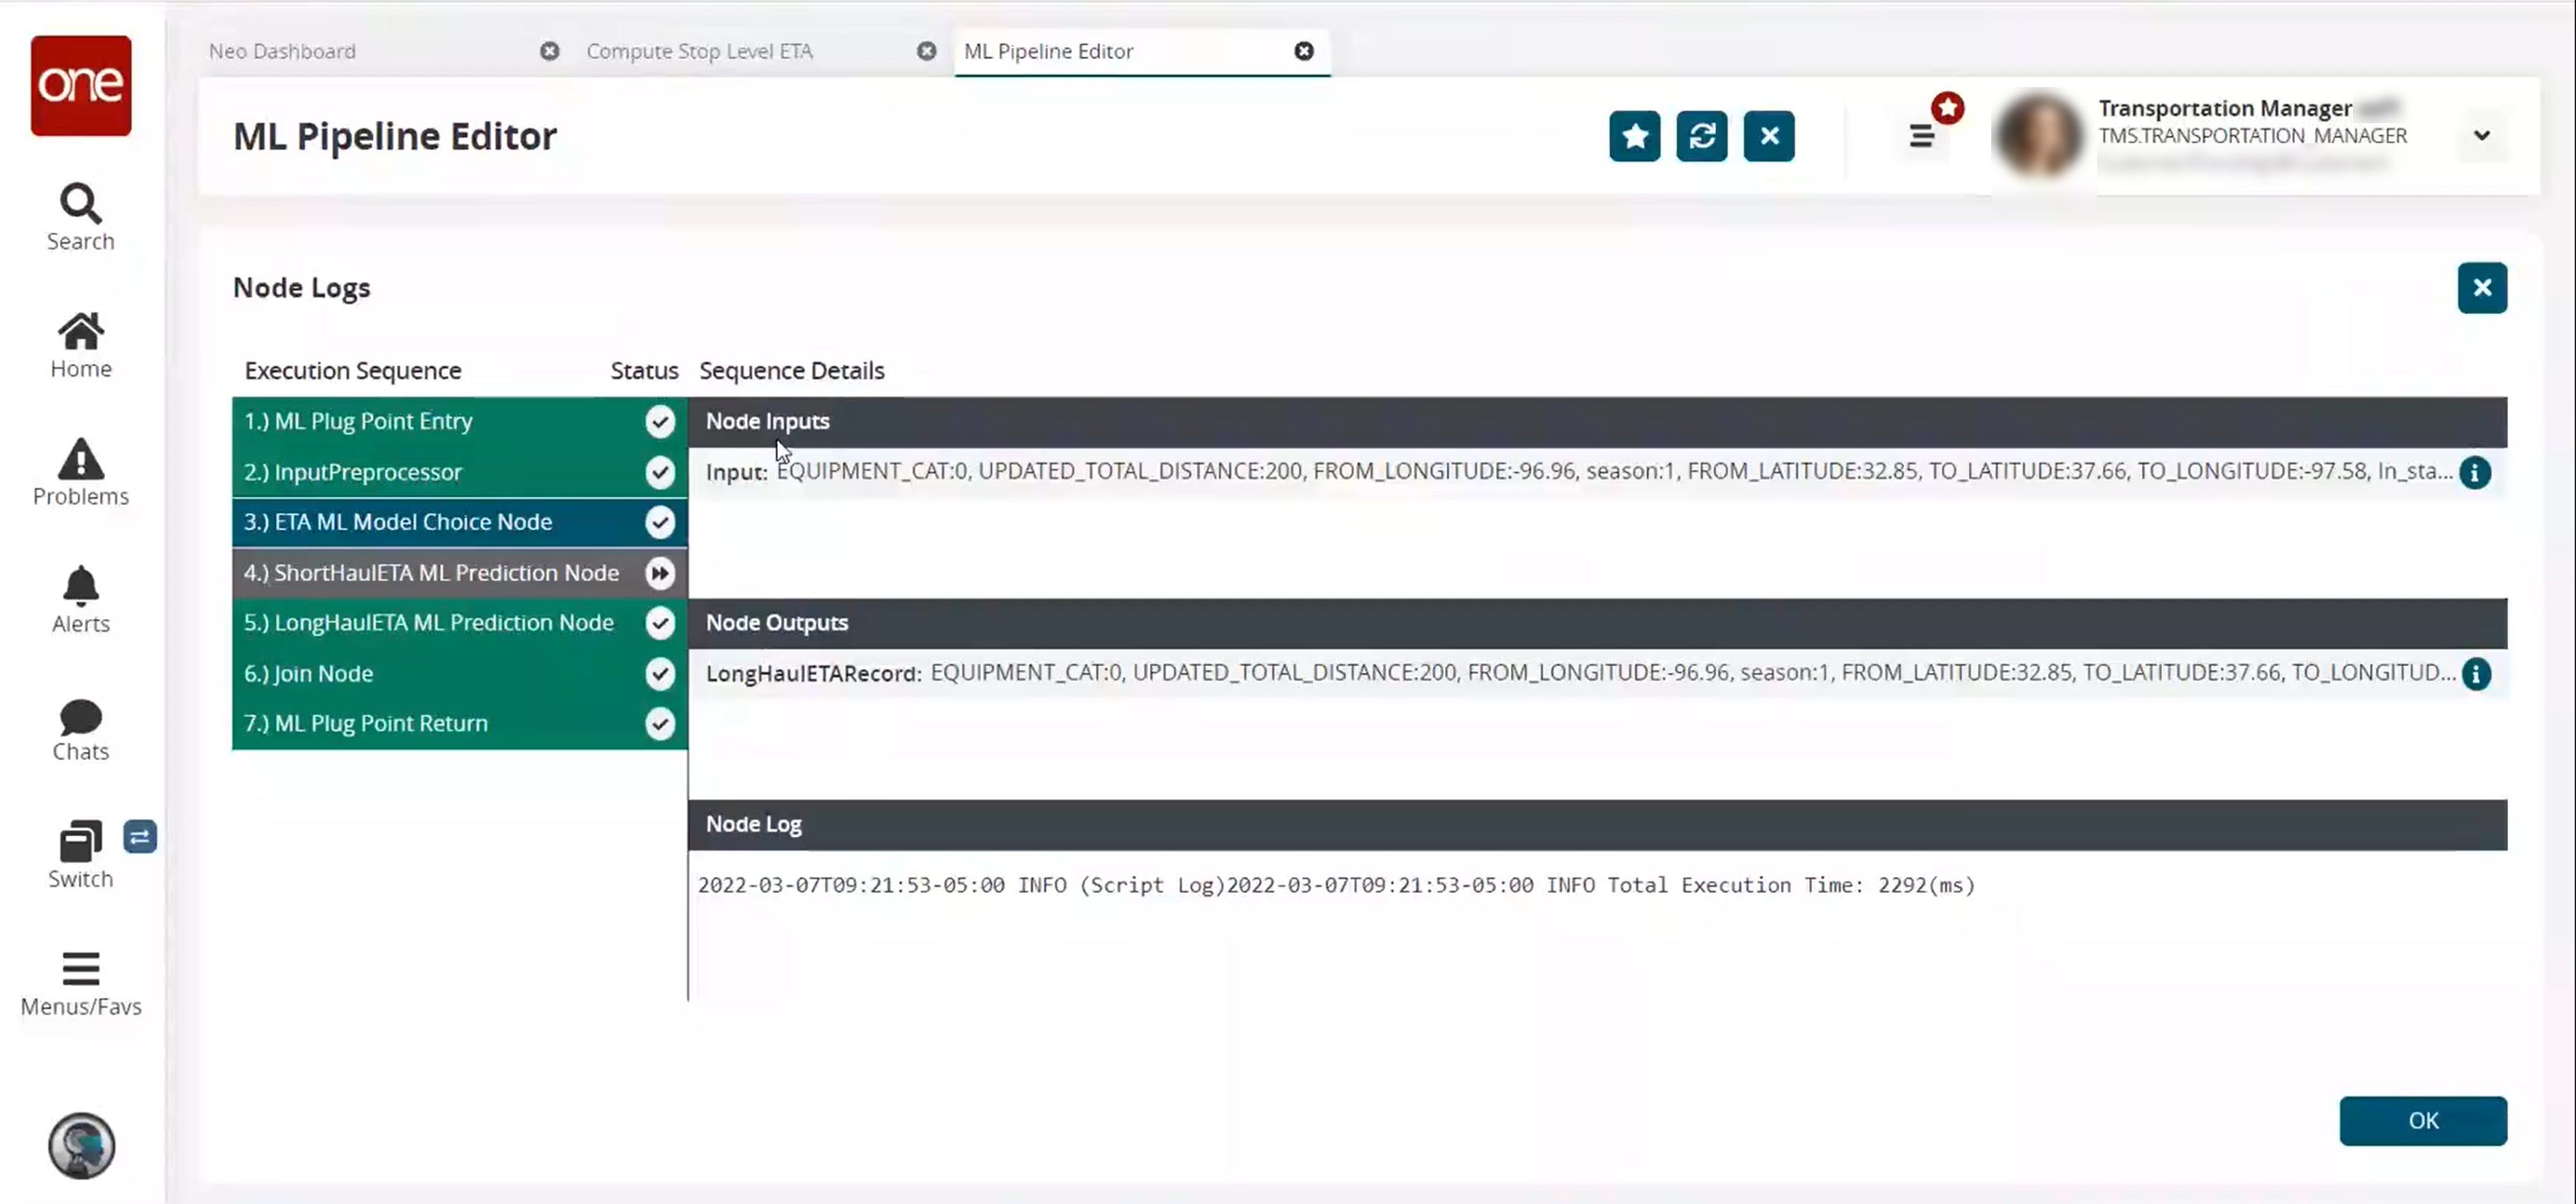
Click OK to return to the ML Pipeline Editor screen.
Click the magnifying glass icons on the bottom left to zoom in and out for the desired view of the pipeline.
Click the lock icon to lock or unlock the current pipeline view.
Click the four arrows icon
 to view the entire pipeline.
Click the auto-arrange icon to automatically arrange the nodes for a more organized view.
A Minimap is displayed at the bottom right corner of the pipeline. The Minimap displays the entire pipeline, enabling the user to easily navigate to the part of the pipeline they want to view and to see which part of the pipeline they are currently viewing. This is especially helpful when working with large pipelines.
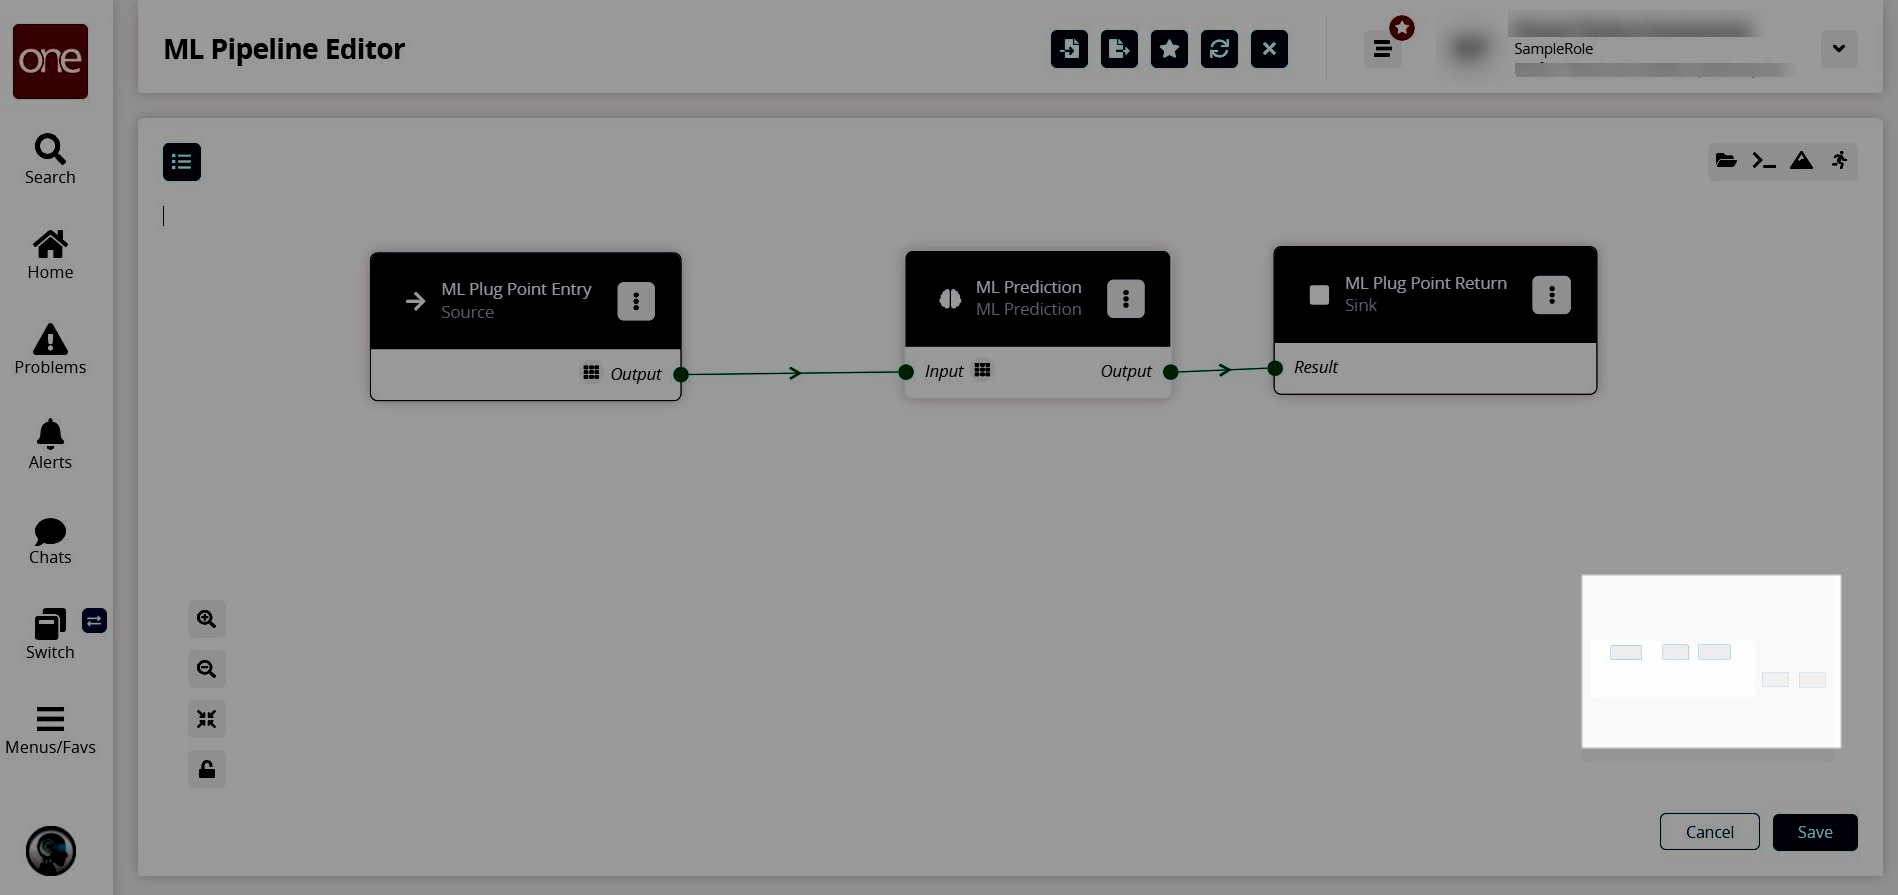
Click the Save button to save the pipeline.
The ML plug point screen displays with the pipeline updated.