Grid Tuning Run Report
The Grid Tuning Run Report is an actionable report that displays all grid tuning runs in the instance.
Complete the following steps to view the Grid Tuning Run Report:
Log in to the ONE system.
Click Menu/Favs > Tools > Grid Tuning > Grid Tuning Run Report.
The Grid Tuning Run Report displays.The following chart details information about the report columns:
Column Name
Description
Id
This column displays the unique ID of the grid tuning run.
Grid Tuning Profile
This column displays the name and the link to the grid tuning profile for which the run was executed.
State
This column displays the state of the run. It can have any of the following values:
Value
Description
Awaiting for tasks
Run is waiting for IDLE/Running grid tasks in the DB.
Running
Run has started.
Stopped
Run has stopped.
Start Time
This column displays the time when the run started. This is the time when the state is changed to Running.
End Time
This column displays the time when the run stopped.
Stop Reason
This column displays the reason the run stopped. It can have any of the following values:
Value
Description
Maximum allowed steps completed
The number of steps specified in Abort after no. of steps of Grid Tuning Profile are executed.
Throughput peak reached
Throughput peak reached or throughput is decreased after adding more threads.
Manually Stopped
The user stopped the run.
Throughput Chart
This column displays a link to open the Throughput Chart. See the Throughput Chart section below for more information.
Resource Utilization Chart
This column displays a link to open the Resource Utilization Chart. See the Resource Utilization Chart section below for more information.
Click Export to CSV to export the report to a CSV file.
In the first column of the report, click a checkbox to select a grid tuning profile, then click the Actions button to view the actions available to be performed on the selected profile.
In the Name column, click a profile name link to view and/or update the profile details.
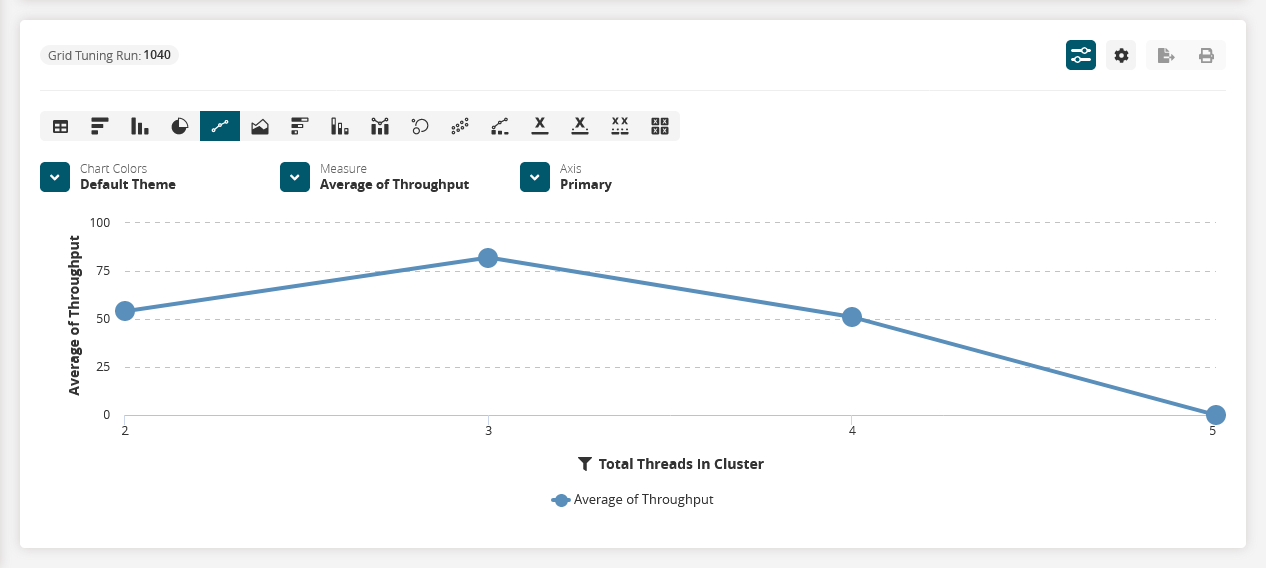
Throughput Chart
This chart displays the throughput of the tuning run for each step. On the X-axis, the total number of active threads in the instance is plotted, and on the Y-axis, the throughput is plotted.
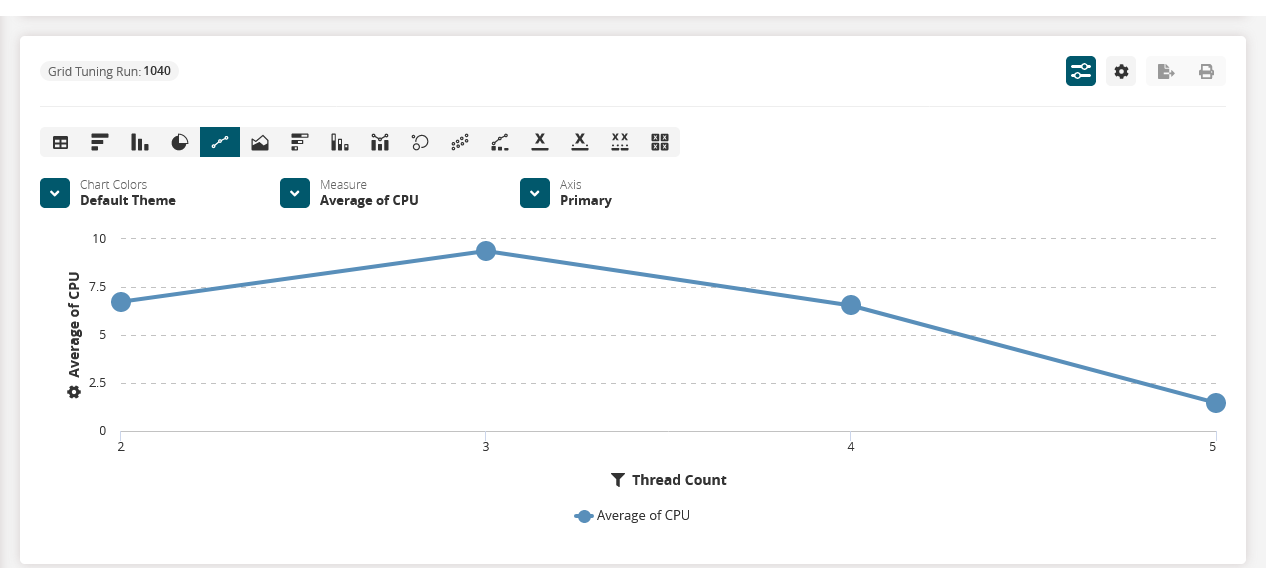
Resource Utilization Chart
This chart can be used to check CPU and Memory utilization (in percentage) throughout the instance and per node. By default, this chart displays the metrics for instance. You can select the node IP from filters to display the metrics per node.