Adding and Creating Custom Analytic Widgets
Custom analytic widgets allow users to create highly customized widgets by selecting the data subset and then selecting and tailoring the data presentation in a table or one of many available charts. The functionality mirrors the pivot table/chart functionality that many reports offer in the ONE system but offers the additional benefit of constant visibility of the data from the dashboard. This set of instructions covers the basic creation of a custom analytic widget at a high level. Please note that many user roles have Custom Analytic Dashboards assigned to them with pre-designed analytic widgets, and different user roles have access to different data sources (facts) from order management and transportation management data. Not all users and roles have access to this particular feature.
Complete the following steps to add and create a custom analytic widget:
L og in to the ONE system.
Click the Edit the Dashboard
 button. (Users may need to navigate to the correct dashboard first.)
The dashboard's edit mode displays.Click the Add Columnar Layout or the Add Fixed Layout buttons to add a new section to the dashboard, if necessary.
Click the plus sign to add a new widget.
The Add a (Fixed or Flexible) Widget popup window displays with the Default Widgets tab selected.Click the Custom Analytic Widgets tab.
A Create a Custom Analytic Widget tab displays.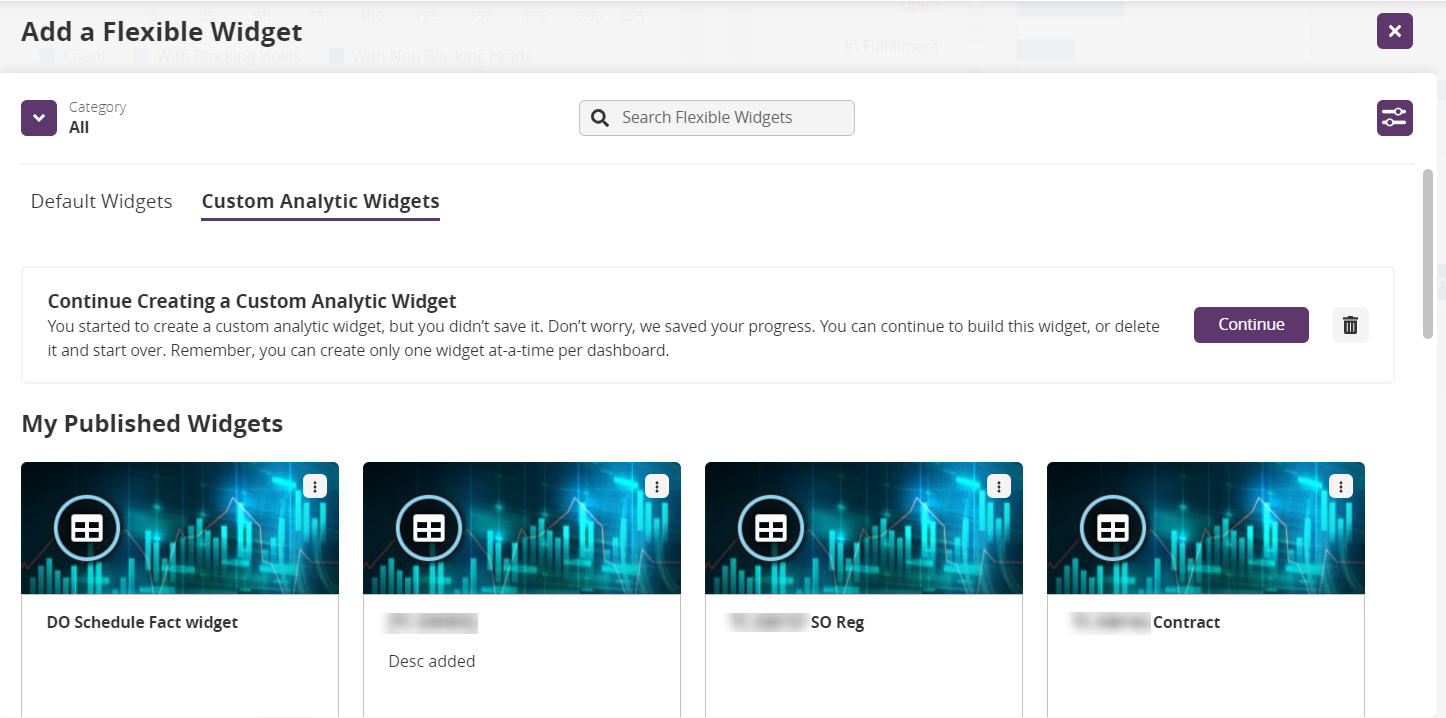
Click the Continue button.
The Create a Widget screen displays. If the data source slideout doesn't display, click the data source list button in the top left corner of the screen.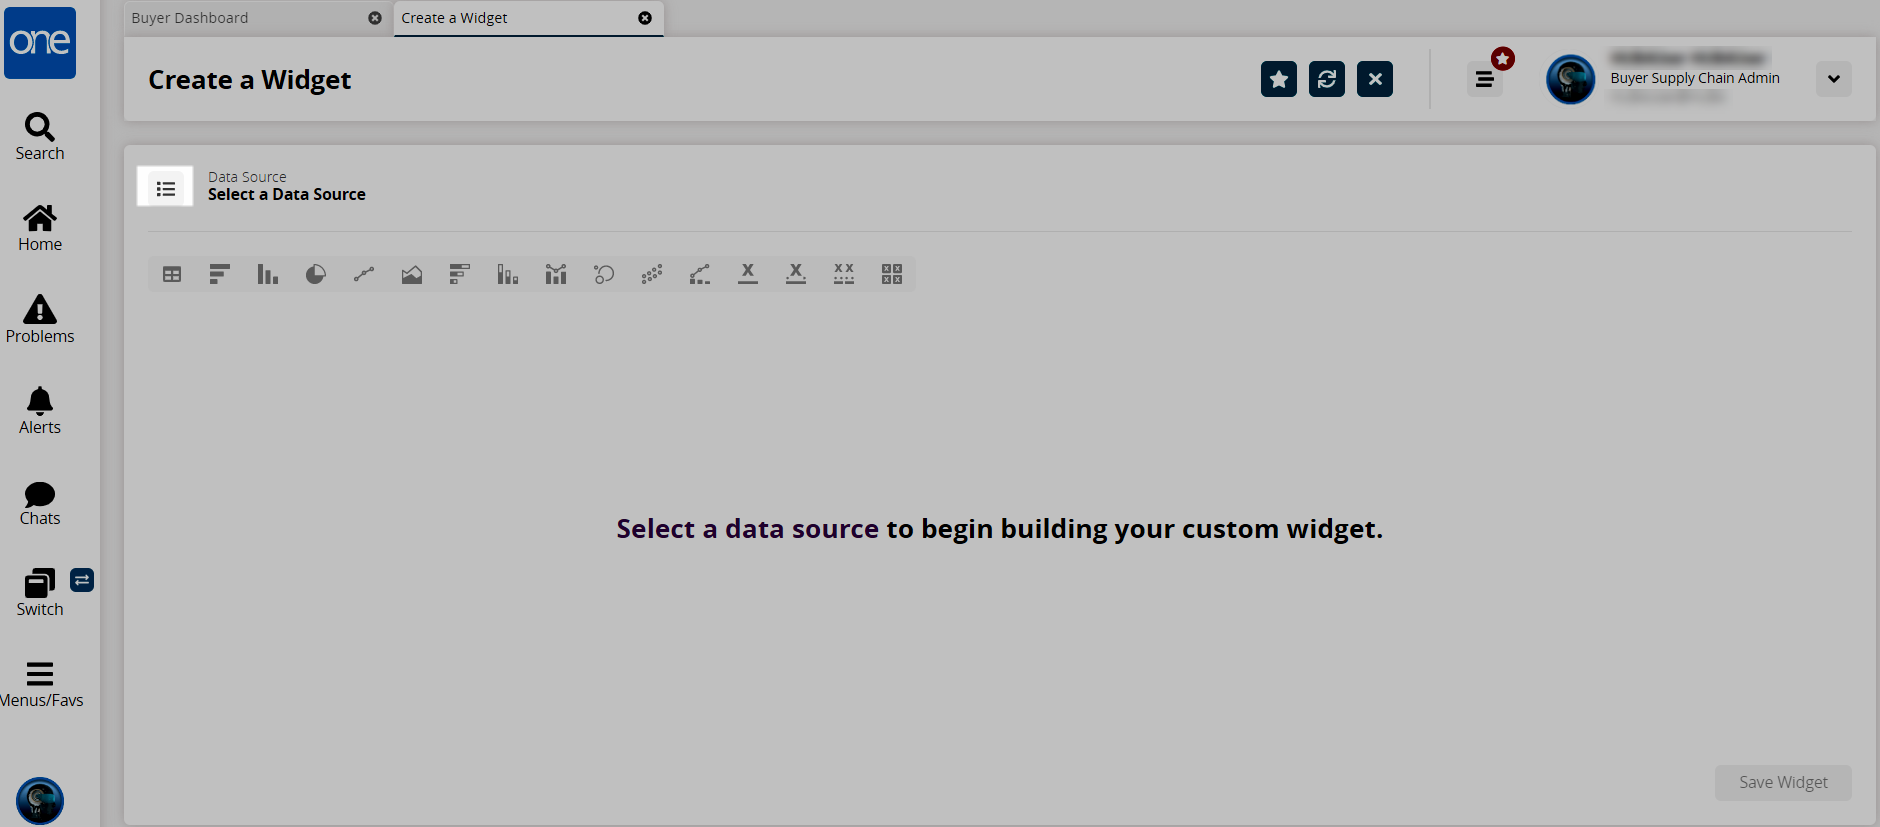
Click on a data source from the left pane of the screen.
The screen updates with the Field popup, which is based on the chart type; the column chart type displays by default. The data source can be changed by clicking on the list button at any time. The chart type displays in parentheses on the popup, and the boxes for the chart elements differ based on the chart type.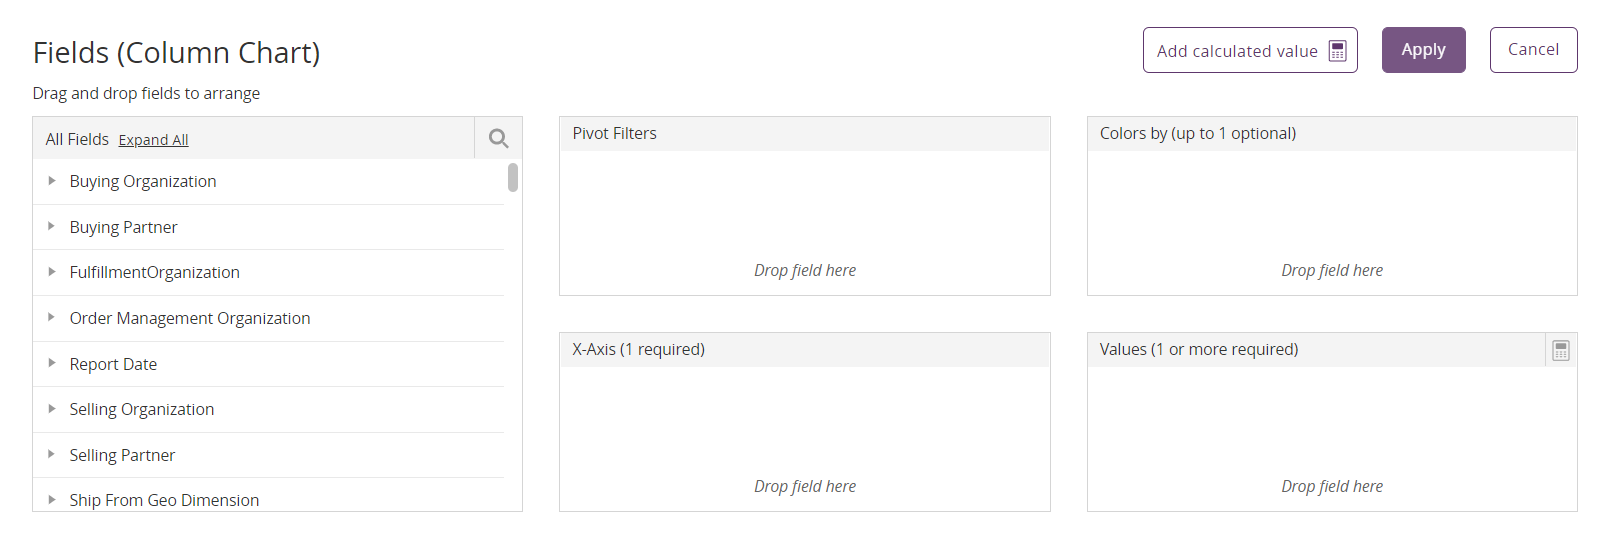
If you need to change chart types, click the Cancel button and select a new chart type from the row of chart icons. Tooltips display to identify each chart type.
Click the gear wheel icon (Fields) to display the Fields popup again.
Click the expand arrow next to specific field categories in the left panel or click the Expand All link.
All relevant fields display.Click on checkboxes to select fields.
The field names display in one of the four boxes to the right: Pivot Filters, Colors by (up to 1 optional), X-Axis (1 required), and Values (1 or more required). Please note the boxes that require at least one field in order to create the pivot table and subsequent charts. The screenshot above shows the Column Chart details.Drag and drop fields to different boxes as required.
Click the Add calculated value button if a formula is required.
The Calculated Value popup window displays.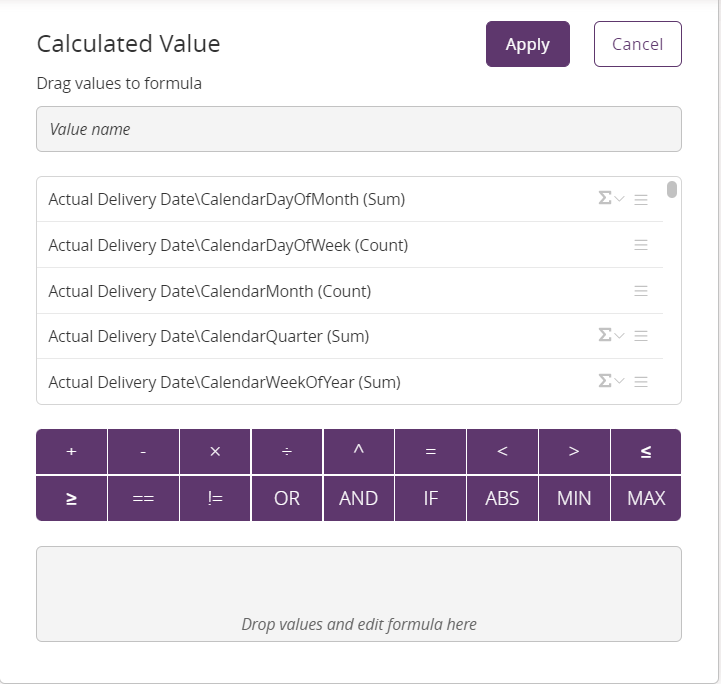
Drag field names and expressions to the bottom box to create a formula.
Click the Apply button.
The Calculated Value popup window closes.Click the Apply button. For information on advanced filtering, see the "Applying Advanced Filters on Custom Analytic Widgets" section of this document.
Dropdown menus for further customization display. These menus vary based on the chart. Some charts may not offer further customization.Select a value from the Chart Colors * dropdown menu. Fields with an asterisk ( * ) are required.
Select a value from the Measure * dropdown menu.
Click the Save Widget button to name this widget.
A popup displays.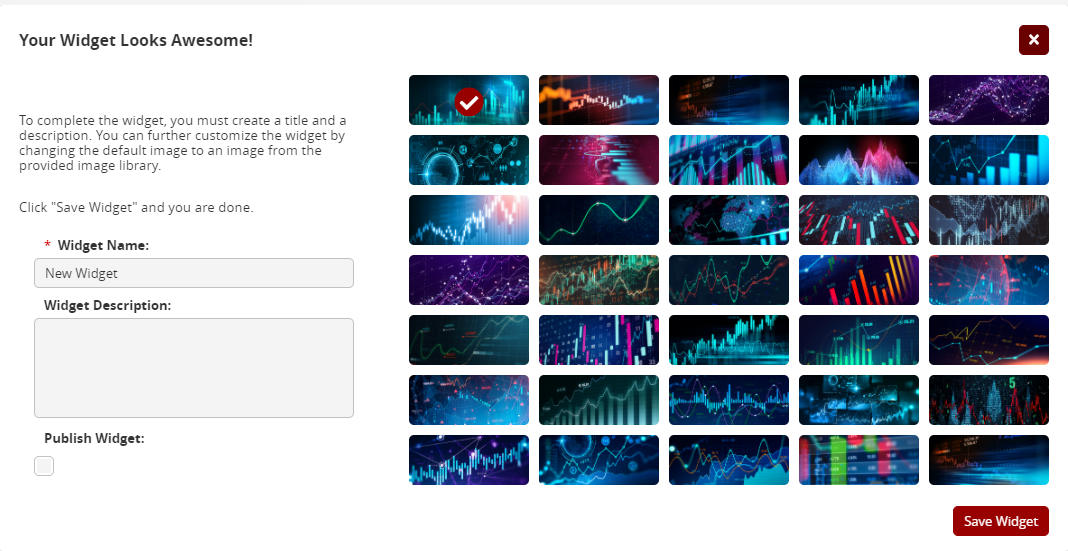
Enter a widget name in the * Widget Name field.
Enter a description for the function of the widget and/or data source in the Widget Description field.
Check the Publish Widget box if you want this widget to be published for other users to subscribe and use the widget.
Click the graphic for the widget that will display for this widget on your dashboard.
Click the Save Widget button.
The new widget displays in the edit mode of the dashboard.Click the Save the Dashboard button.
The new widget displays in the dashboard.