Administering Timeline Data
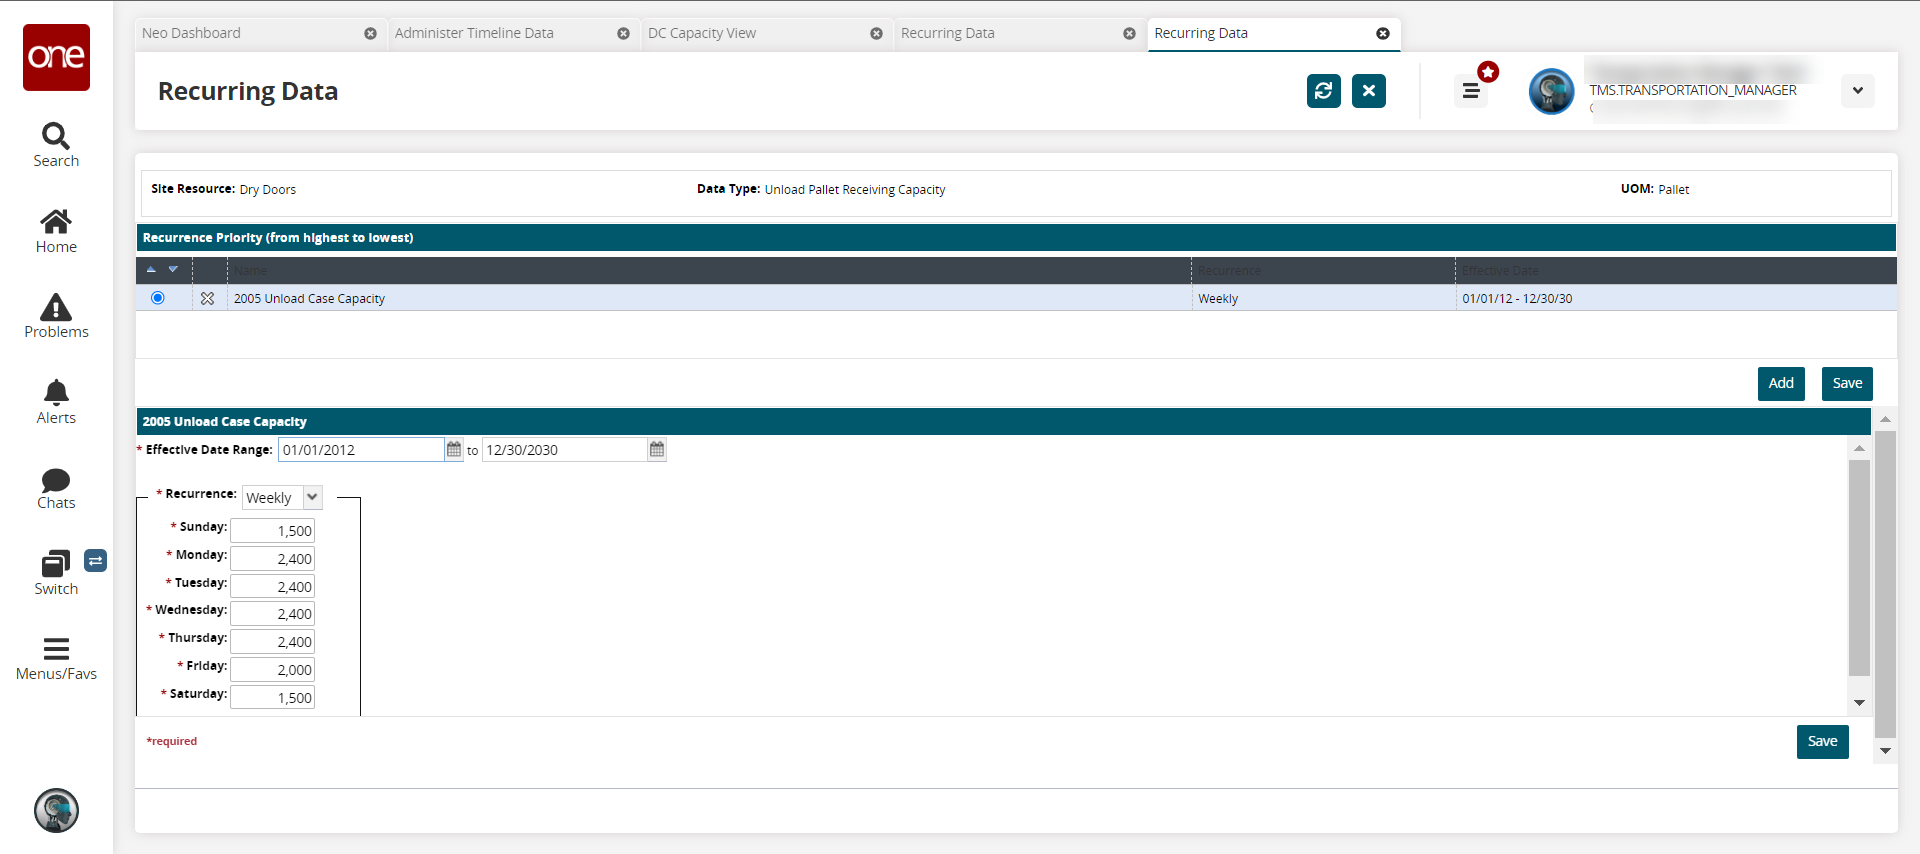
Administer Timeline Data supports recurring as well as override capacity for the following data measures:
Receiving Appointment Capacity
Receiving Pallet Capacity
Receiving Case Capacity
Shipping Appointment Capacity
Shipping Pallet Capacity
Shipping Case Capacity
Putaway Labor Capacity (defines the available workforce for unloading)
Putaway Receive Rate (defines the rate of receiving)
Rack Storage Capacity (defines the rack storage capacity that can be computed in terms of Pallet Capacity and Weekly Forecast)
Demand Factor (defines expected daily shipments that can be used in Daily Forecast computation)
Operating Hour Capacity (defines the number of working hours available for the day)
QA Inspection Rate (defines the speed of QA inspection of the receiving shipments)
Complete the following steps to administer timeline data:
L og in to the ONE system.
Select Menus/Favs > Scheduling > Projected Capacity Views > Administer Timeline Data. In the NEO UI, users can click on the Menus/Favs icon on the left sidebar and type in the name of the screen in the menu search bar. For more information, see "Using the Menu Search Bar."
The Administer Timeline Data screen displays.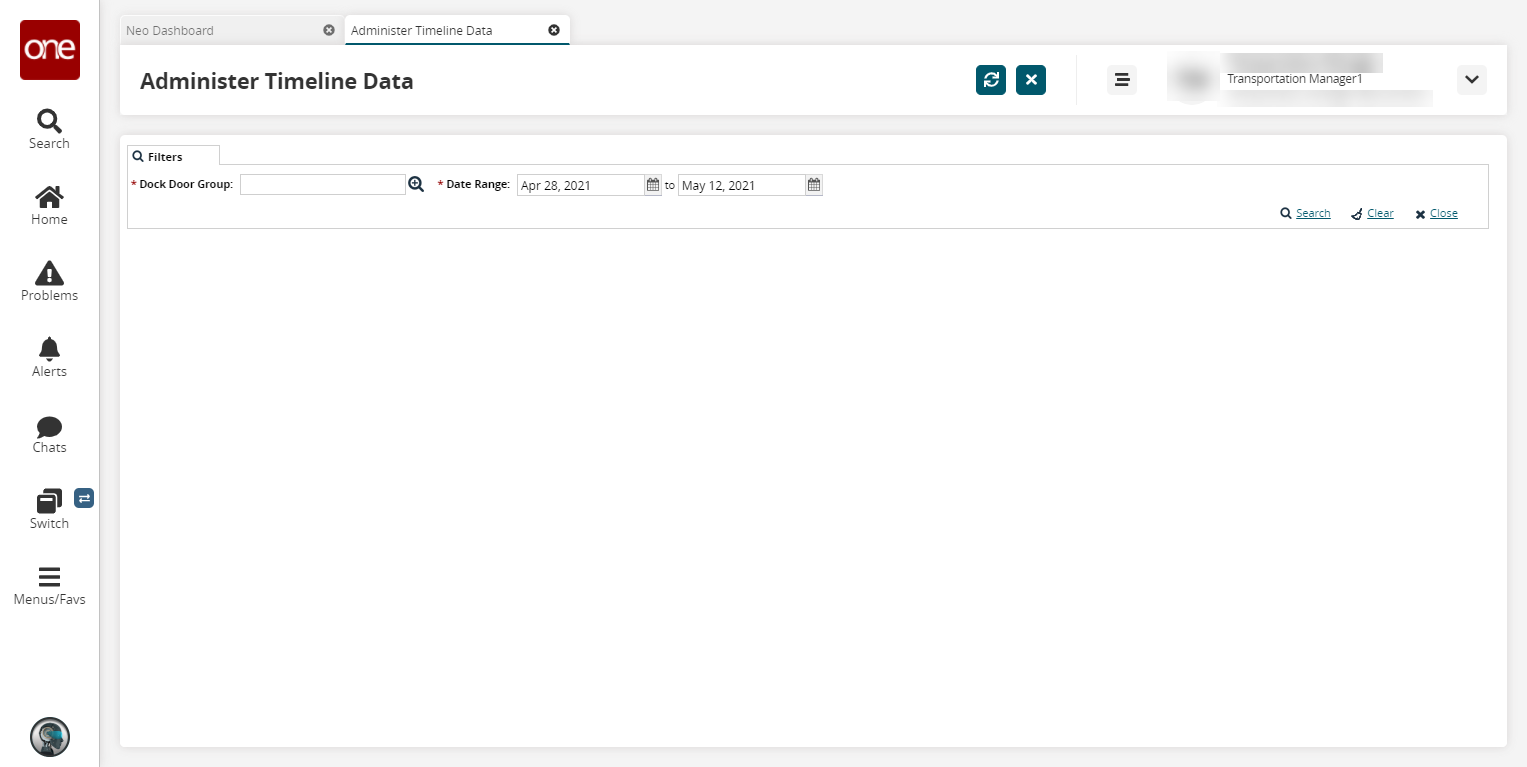
Use the picker tool for the * Dock Door Group field.
Select start and end dates for the * Date Range using the calendar tool.
Click the Search link. A table showing data measures for the specified dock door group displays.
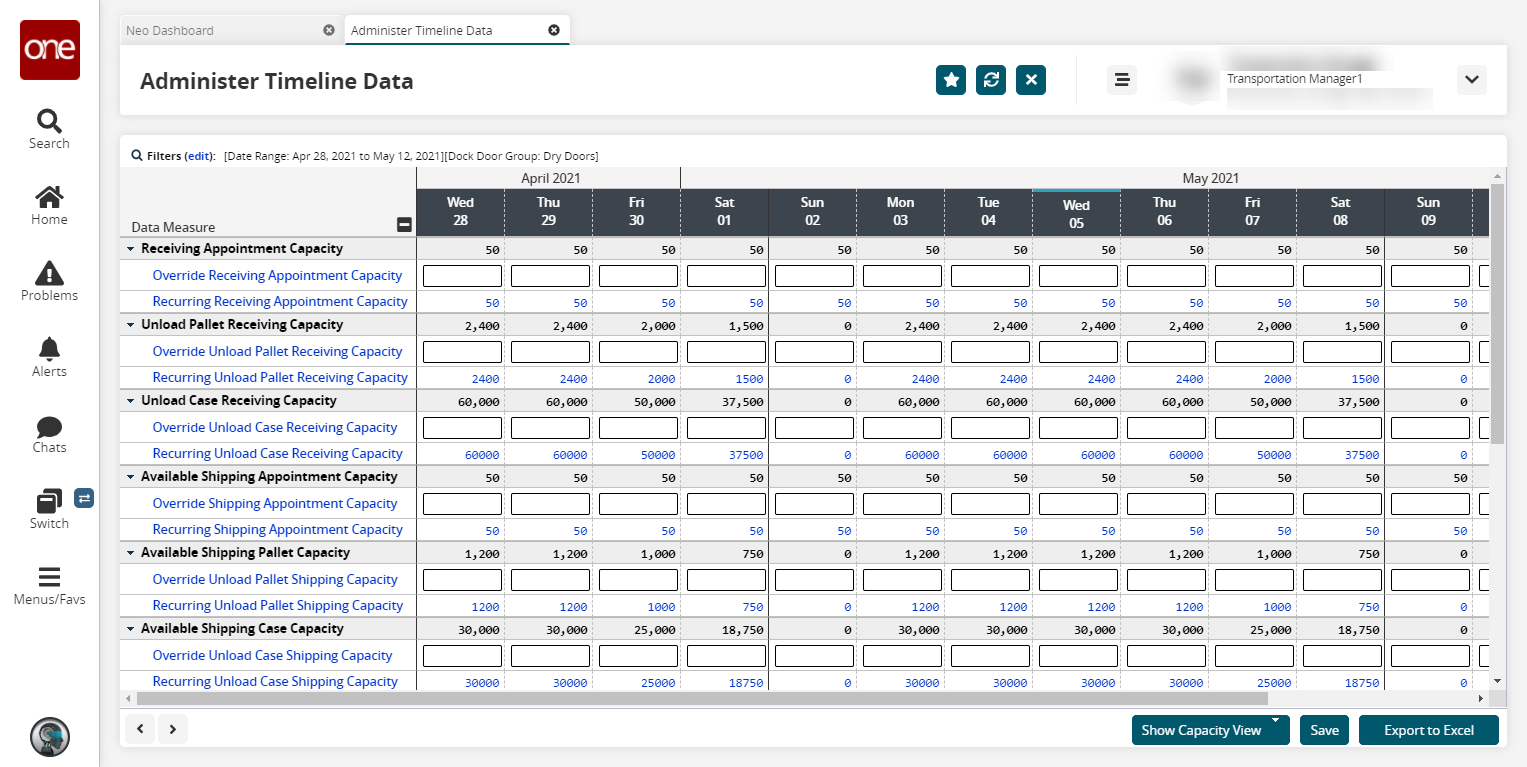
Click inside an override field, and type a value to override the capacity.
Click the Save button.
The override value becomes the capacity value.Click the Show Capacity View button, and select a capacity view option to select a capacity view.
The following figure shows the DC Capacity View.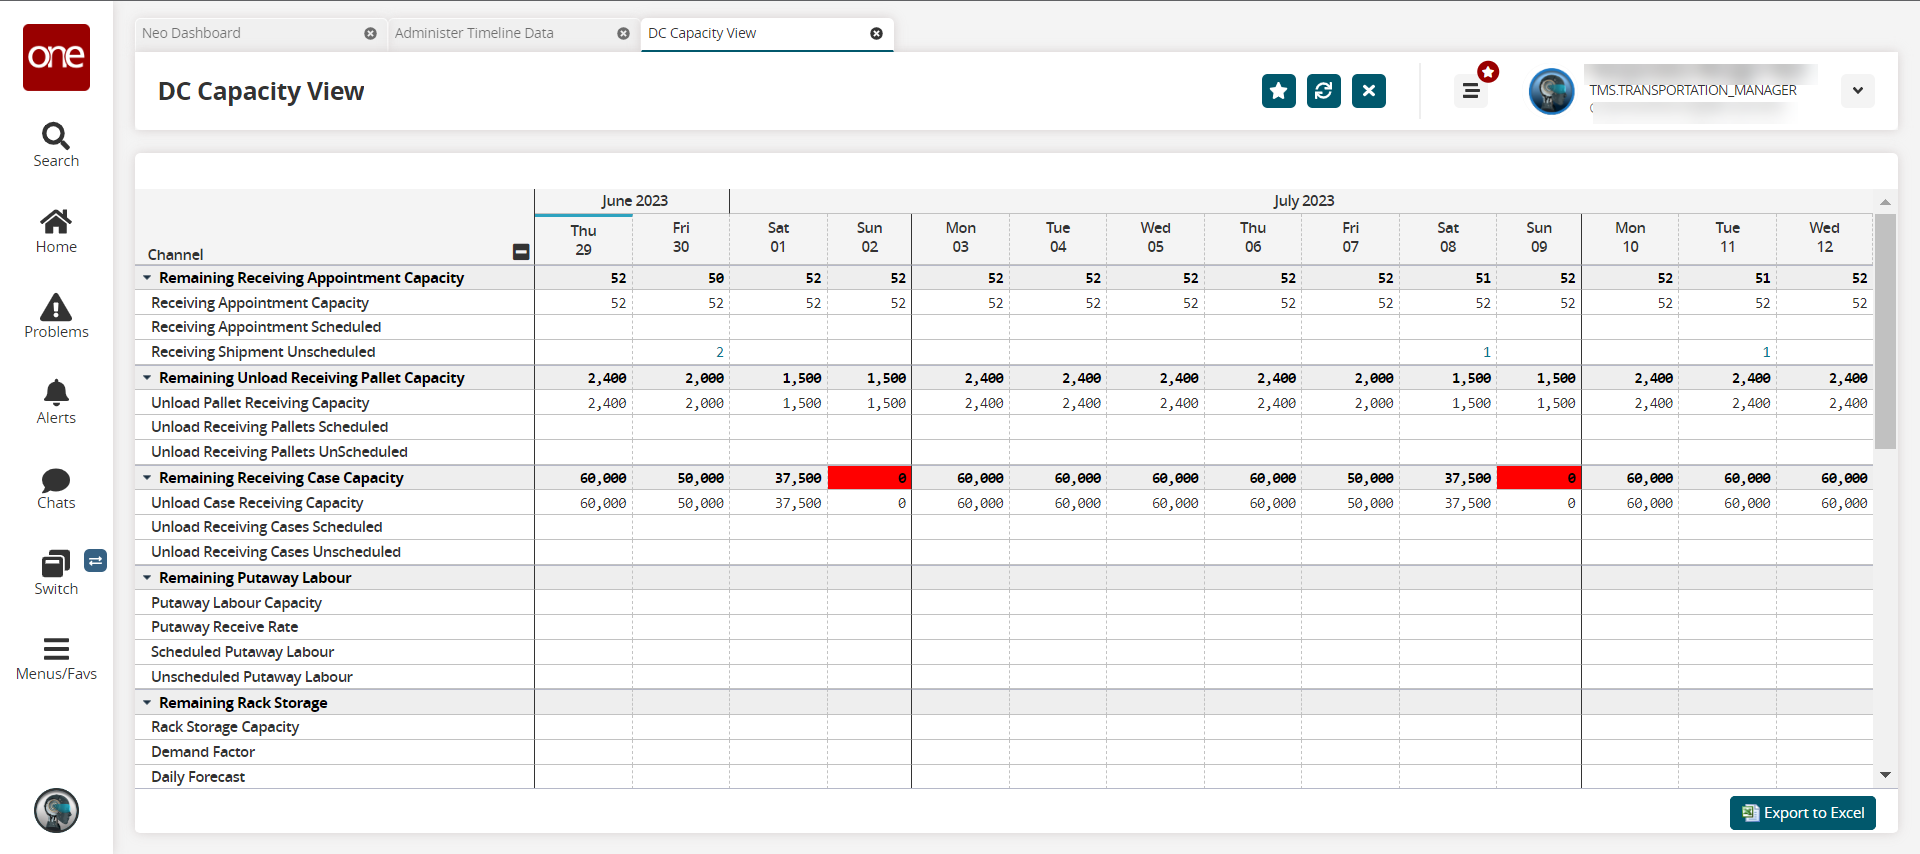
Click any link to view the details of the site's capacity for that data measure.
Click the Export to Excel button to download a file of the data in Excel to your computer.