Projected Capacity Views
You can choose to view projected capacity views for the following options:
Detailed Capacity By Dock Door Group
Detailed Shipping Capacity By Site
Detailed Receiving Capacity By Site
Capacity Summary By Sites
You also have the option to administer timeline data, which allows projected capacity view timeline data to be searched by dock door group and date range. Afterward, you can override capacities and view various capacity views.
Viewing Projected Capacity Views
You can select projected capacity views for shipping and receiving capacity by site, a capacity summary by site, or a detailed capacity view by dock door group. With the Detailed Capacity By Dock Door Group option, you can create user-defined data measures that are either based on computations of existing data measures or based on manual entry.
Complete the following steps to view projected capacity views:
L og in to the ONE system.
Select Menus/Favs > Scheduling > Projected Capacity Views > Detailed Capacity By Dock Door Group. In the NEO UI, users can click on the Menus/Favs icon on the left sidebar and type in the name of the screen in the menu search bar. For more information, see "Using the Menu Search Bar."
The Detailed Capacity By Dock Door Group screen displays. This example details the Detailed Capacity By Dock Door Group screen; but from the Projected Capacity Views menu, you can select the other options.
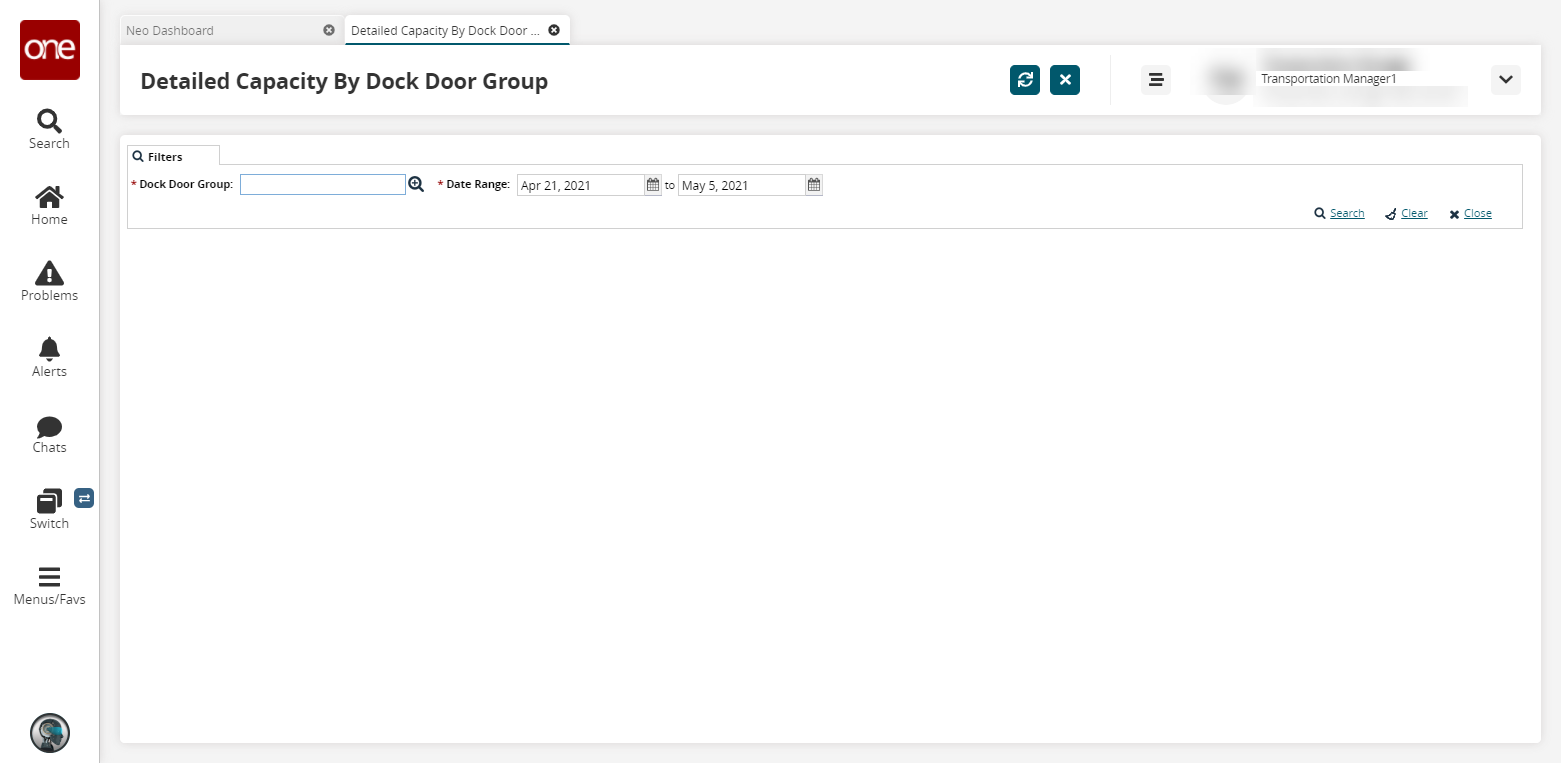
Select a * DockDoorGroup using the picker tool. Fields with an asterisk ( * ) are required.
Enter a * Date Range using the calendar tools. The date range maximum is 30 days per search.
Click the Search link.
In this example, the table displays shipping and receiving capacity data measures for an appointment, pallet, and case at the specified dock door group (Dry Doors). Each data measure displays in a gray row that shows its net capacity value for each bucket in a time range. By default, the data measure row displays expanded to show timelines for total, recurring, override, and used capacity, as well as scheduled and unscheduled values per day. Clicking the data measure row expands and collapses the row. If the capacity for a time bucket is 0, the cell background color is red.
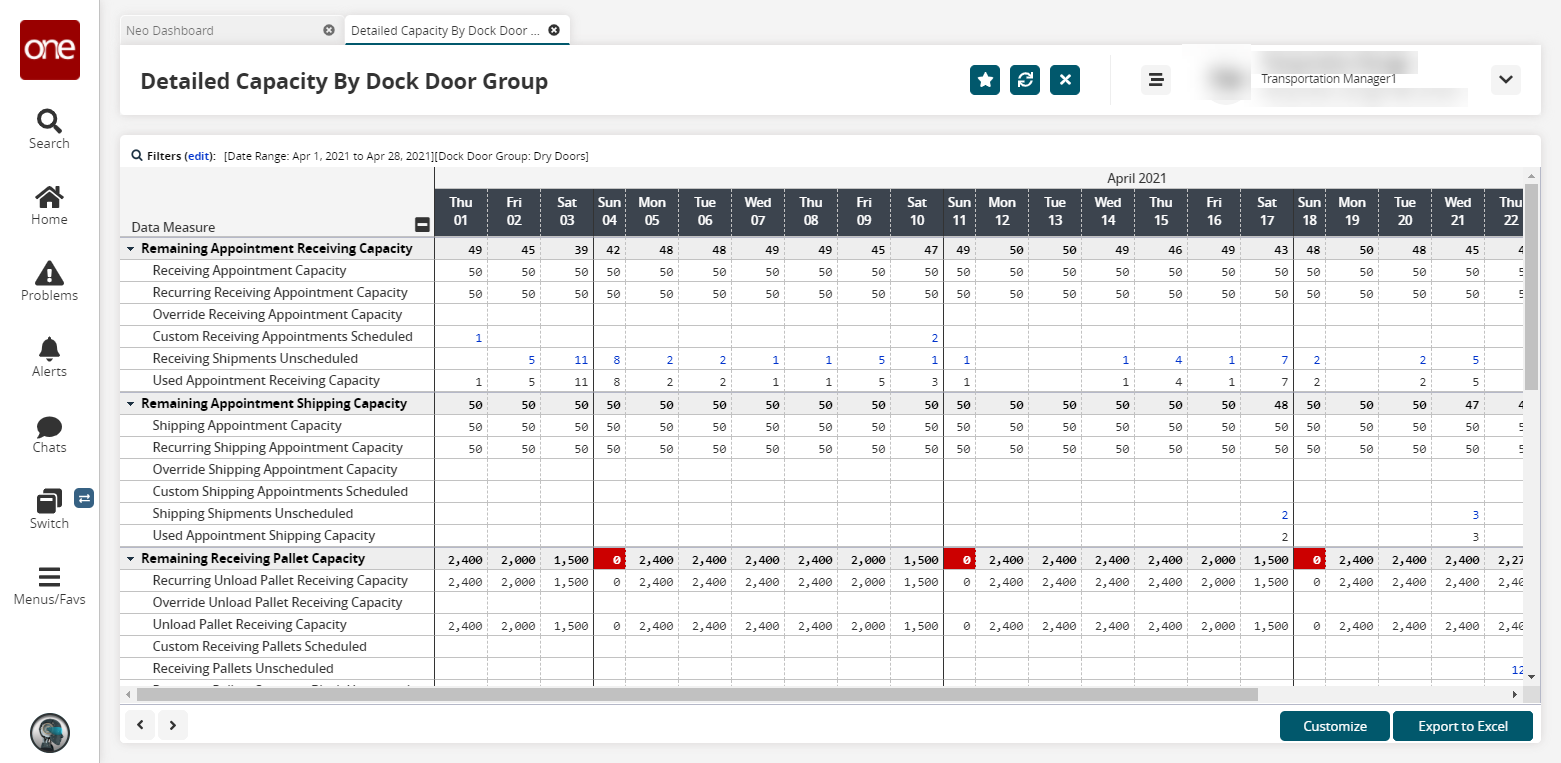
Click the numeric link to view detailed information about scheduled and unscheduled data values for a specific date.
The detailed information displays in a new tab. This figure shows the Receiving Appointment Unscheduled UI.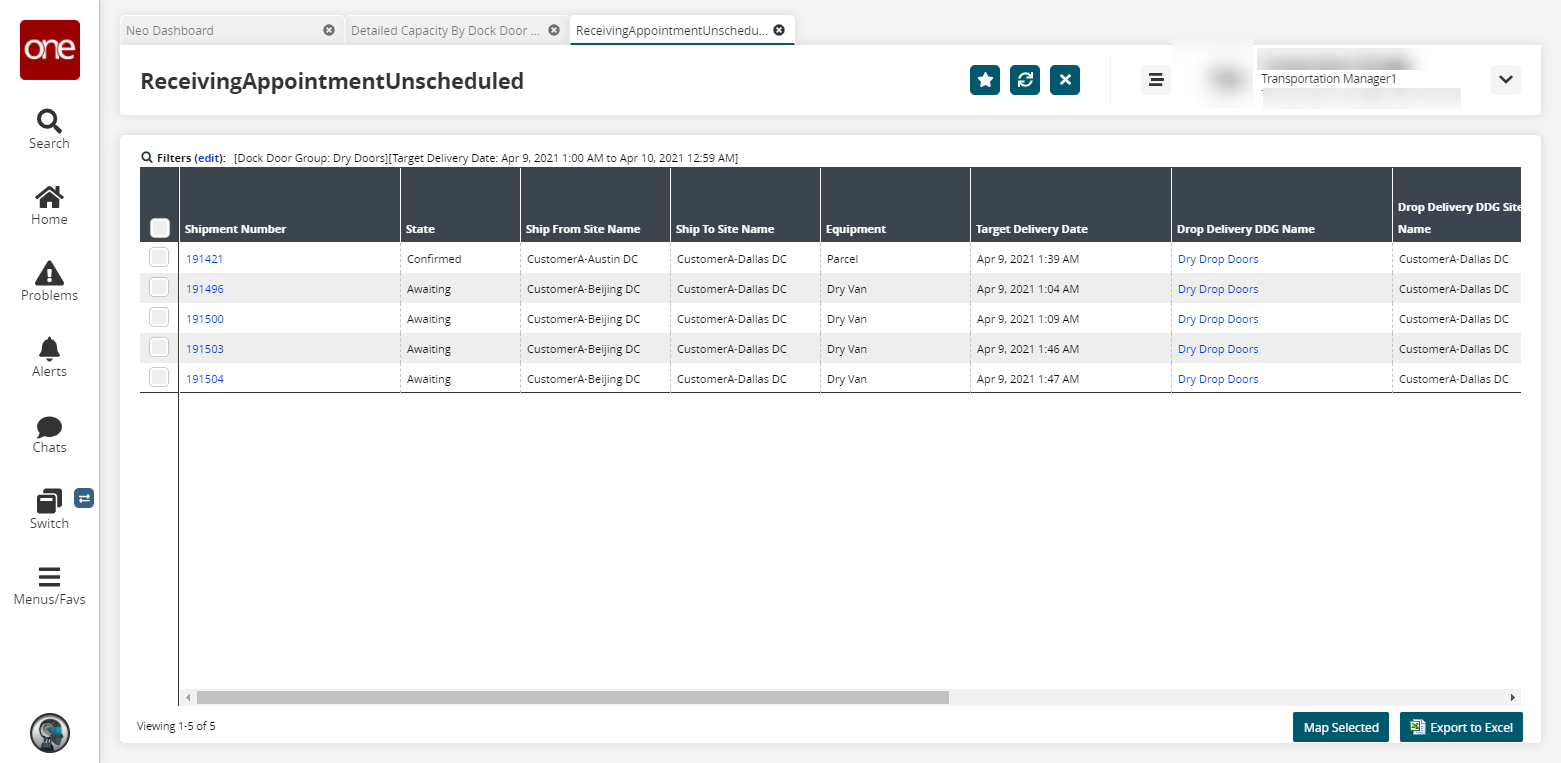
Click the Export to Excel button on the Detailed Capacity By Dock Door Group UI to download the data in an Excel file to your computer.
Customizing Data Measures
You can add and define a custom data measure using the Customize option.
The Transportation Manager can customize the Projected Capacity View; however, this customization displays for the entire company. You may want to coordinate the information displayed in the PCV with other company staff.
Complete the following steps to customize data measures:
Click the Customize button from the Detailed Capacity By Dock Door Group screen.
A Customization Level popup displays.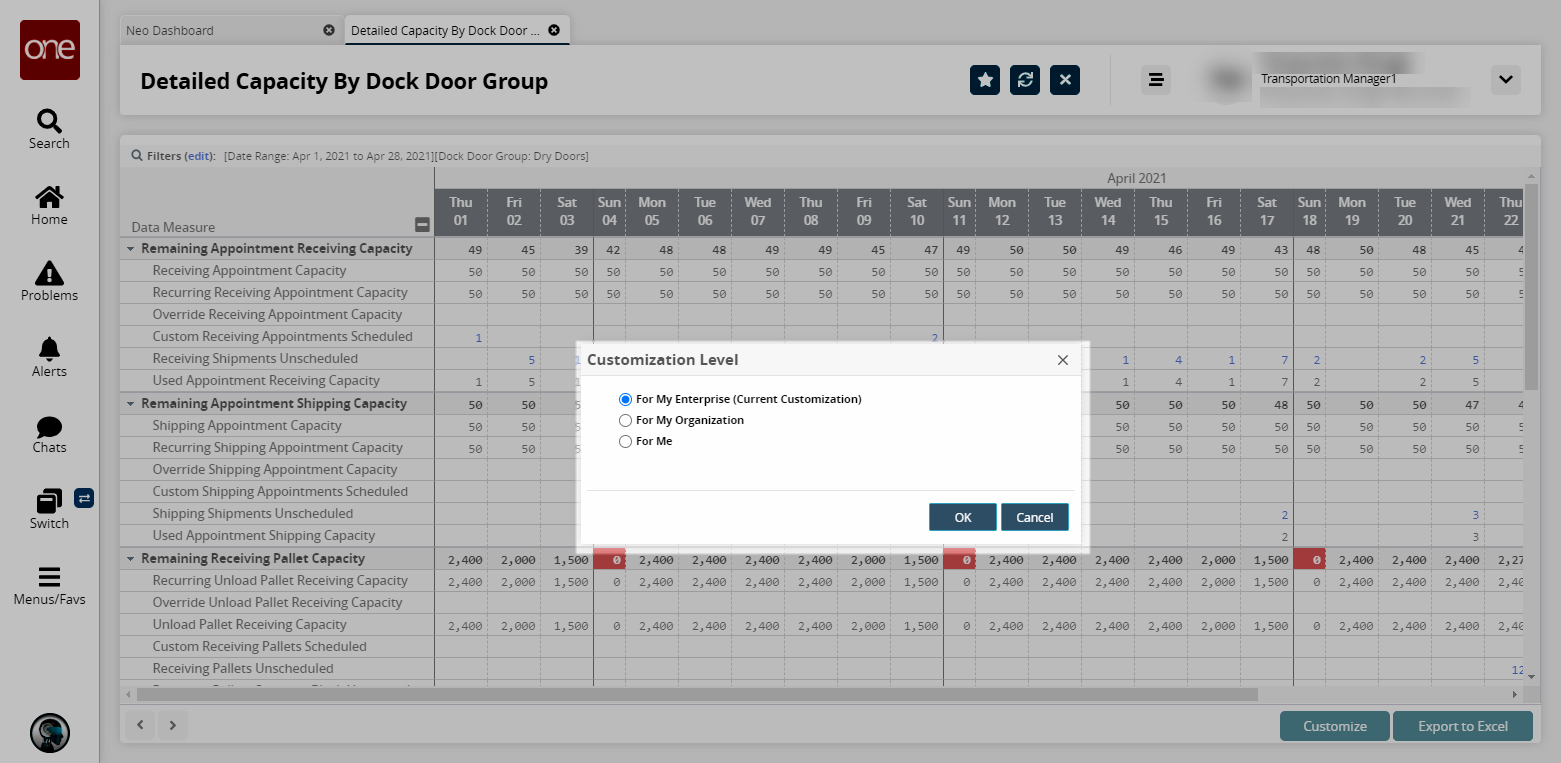
Select either For My Enterprise, For My Organization, or For Me.
Click the OK button.
A column of Add buttons displays next to the data measure names.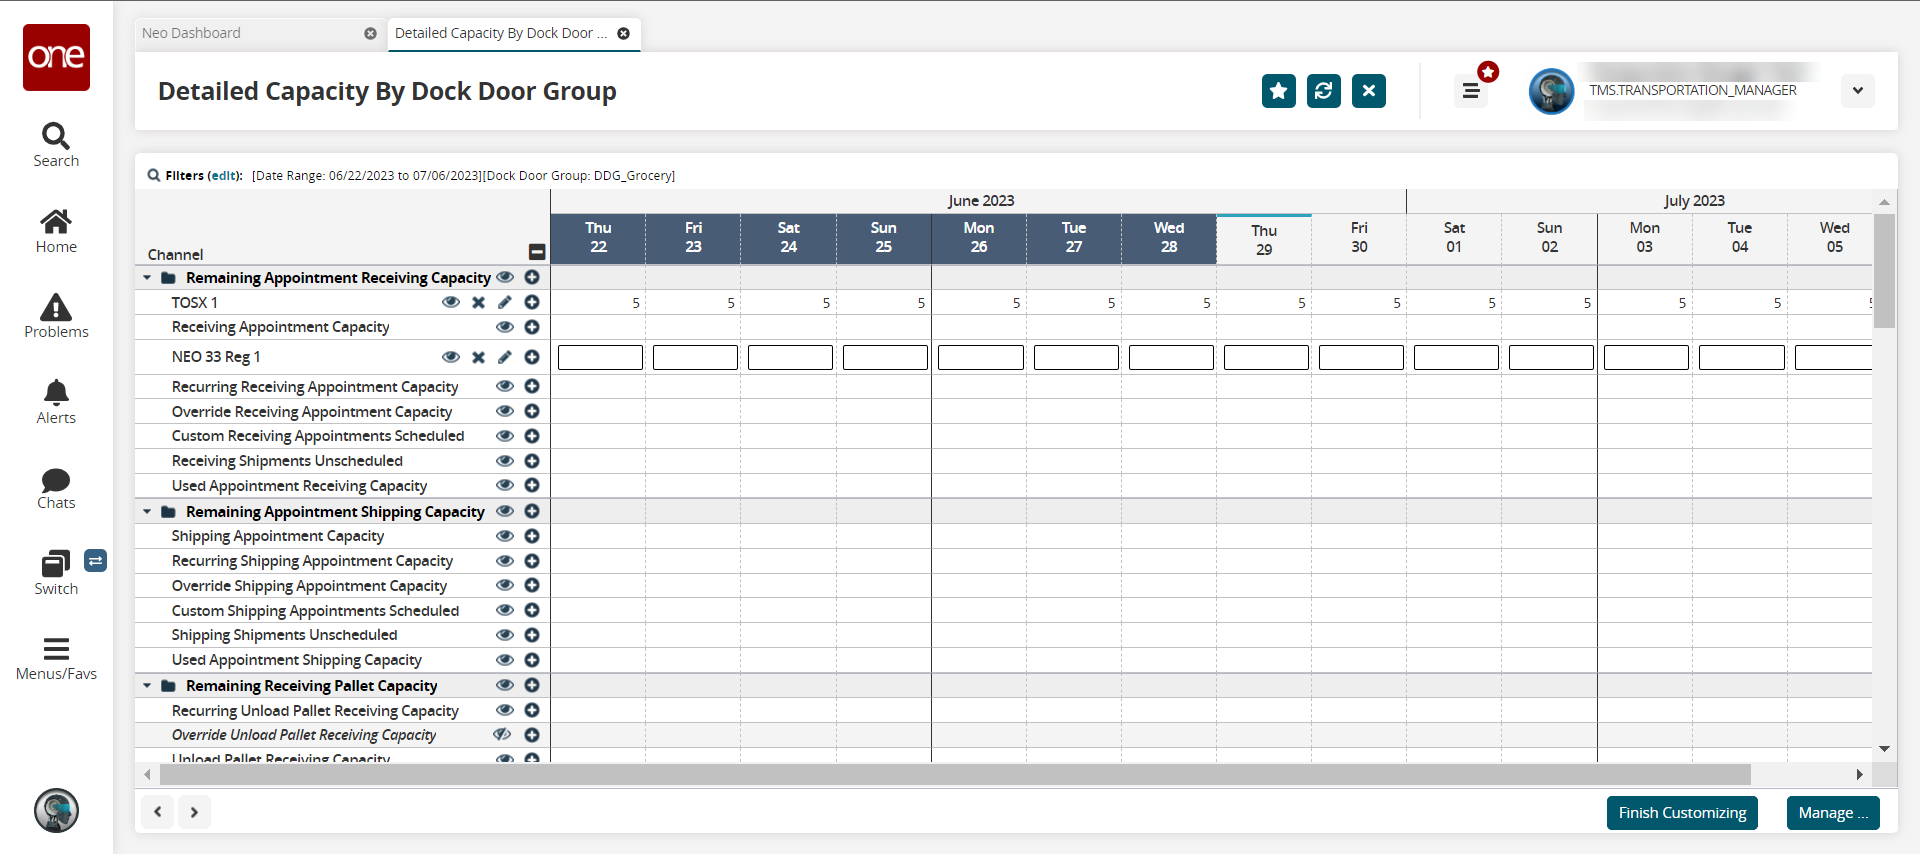
Click the Add icon (plus sign) of the data measure where you want to add a new data measure, and then select an option: Add Data Measure Above or Add Data Measure Below.
The Add Data Measure popup box displays.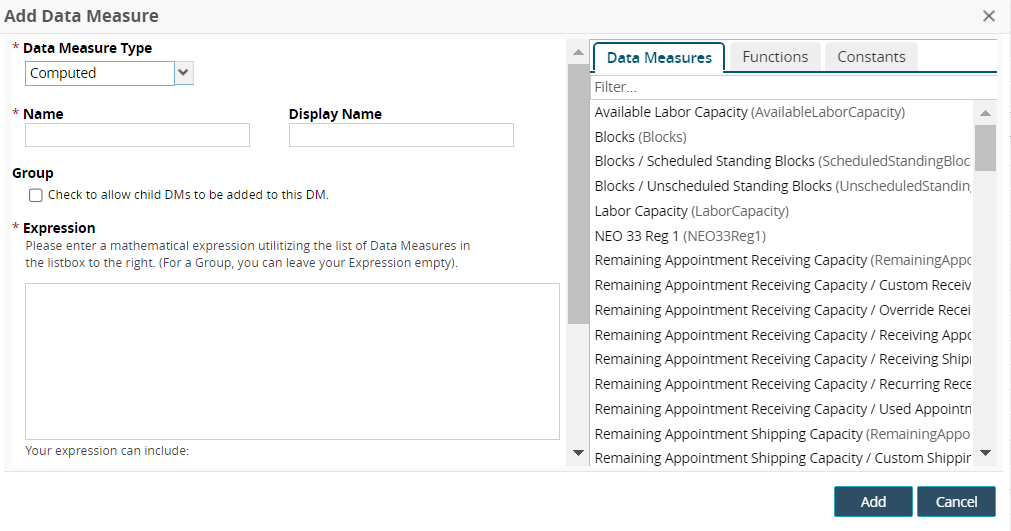
Fill out the following fields. Fields with an asterisk ( * ) are required.
Field
Description
* Data Measure Type
Select a data measure type from the dropdown list.
* Name
Enter a name for the data measure. Use either underscore characters instead of spaces between words in the name, as in Total_Capacity, or use camel case, as in TotalCapacity.
Display Name
Enter a display name displayed in the UI.
Group
Select this checkbox to allow child data measures to be added to this data measure.
* Expression
Create a mathematical expression using the appropriate elements. Click the available Data Measures, Functions, and Constants tabs to insert data measures and functions.
Data Measure references from the Data Measures tab
Numbers
Mathematical operators: +, -, *, /
Predefined functions from the Functions tab
Comparators: >, >=, =, <=, <
Parentheses
Click the Add button.
The new data measure displays. Options for user-created data measures also display deleting and editing icons.Click the eye icon to hide or make visible a data measure row.
Click the X icon to delete a user-created data measure.
Click the pencil icon to edit a user-created data measure.
The Edit Data Measure popup displays.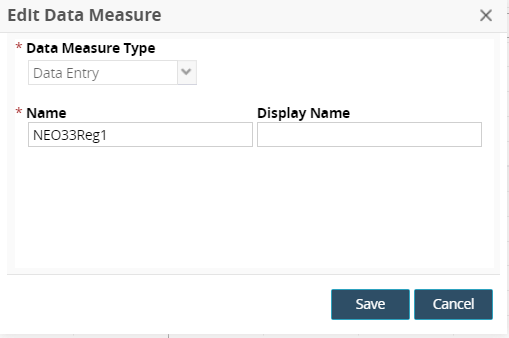
Edit the * Data Measure Type, * Name, and/or Display name fields.
Click the Finish Customizing button.
The customization icons are no longer visible.Click the Save button.