Forecast and Demand History Review
Forecast and Demand History Review allows users to view both demand forecast and history in the same timeline view.
Complete the following steps to view forecast and demand history reviews:
L og in to the ONE system.
Click Menus/Favs > Demand Planning > Forecast and Demand History Review. In the NEO UI, users can click on the Menus/Favs icon on the left sidebar and type in the name of the screen in the menu search bar. For more information, see "Using the Menu Search Bar."
The Forecast and Demand History Review screen appears.
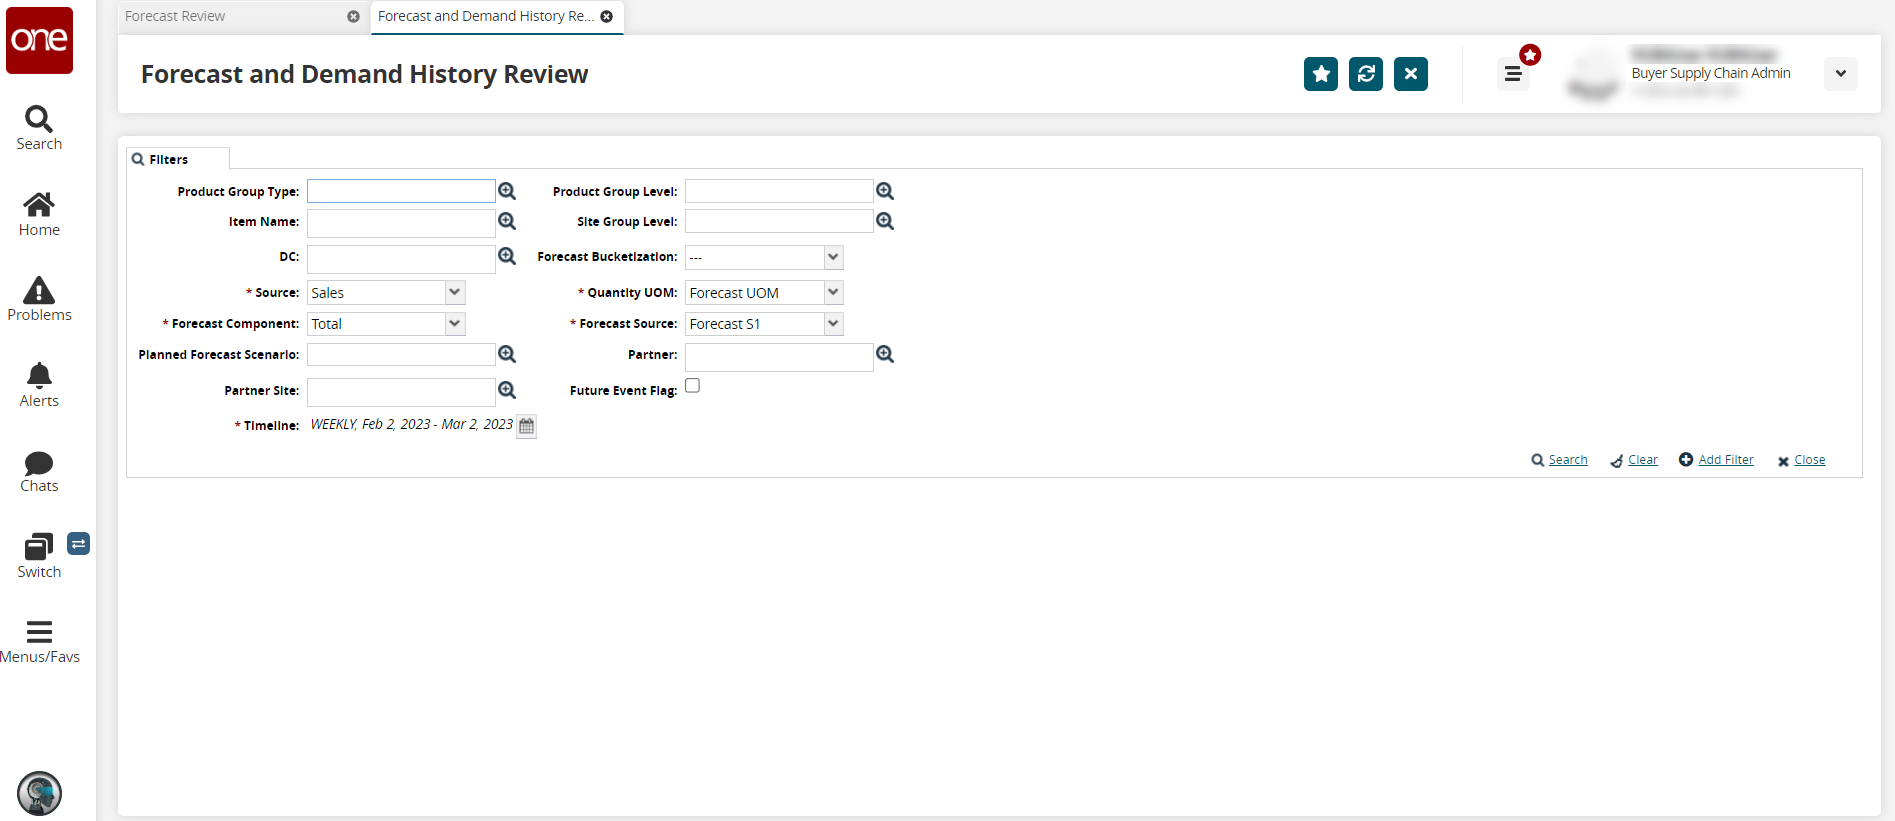
Fill out the following fields. Fields with an asterisk ( * ) are required.
Field
Description
Product Group Type
Enter or select a product group type using the picker tool.
Item Name
Enter or select an item name using the picker tool.
DC
Enter or select a distribution center (DC) using the picker tool.
* Source
Enter or select a data source from the dropdown menu.
* Forecast Component
Select a forecast component from the dropdown menu.
Planned Forecast Scenario
Enter or use the picker tool to select a planned forecast scenario.
Partner Site
Enter or use the picker tool to select a partner site.
* Timeline
Click the calendar tool to set a date range.
A popup displays, and both fields are required.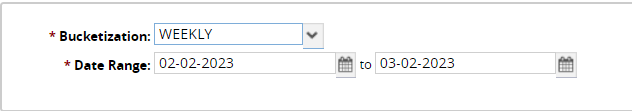
Select a time bucket for * Bucketization from the dropdown list.
Use the calendar tool to select the beginning and end dates for the * Date Range.
Product Group Level
Enter or select a product group level using the picker tool.
Site Group Level
Enter or select a site group level using the picker tool.
Forecast Bucketization
Select a time bucket from the dropdown list.
* Quantity UOM
Enter or select a unit of measure from the dropdown menu. Custom UOMs are supported in this field when properly configured.
* Forecast Source
Enter or select a forecast source from the dropdown menu.
Partner
Enter or use the picker tool to select a partner.
Future Event Flag
Select this checkbox only to display forecasts with events in the future.
Click the Search link.
The search results appear.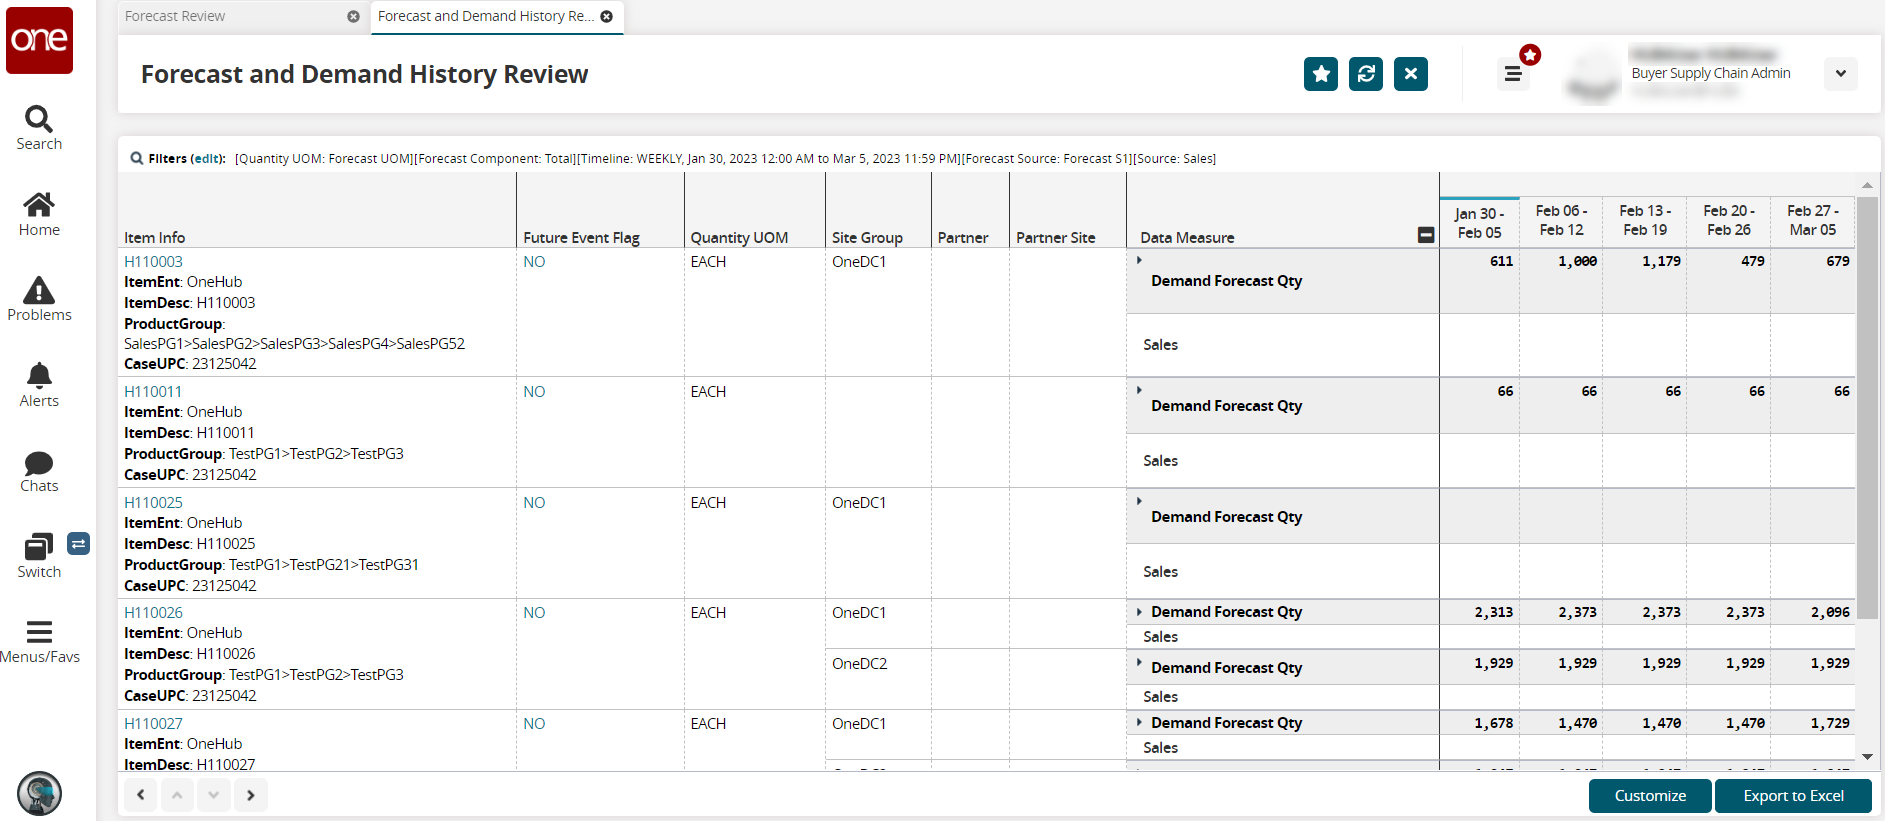
Click the Customize button.
The Customization Level popup displays.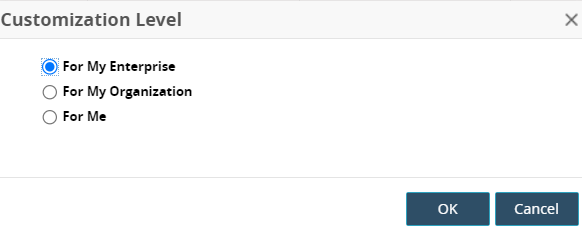
Select the appropriate level, and click the OK button.
The screen refreshes with customization tools.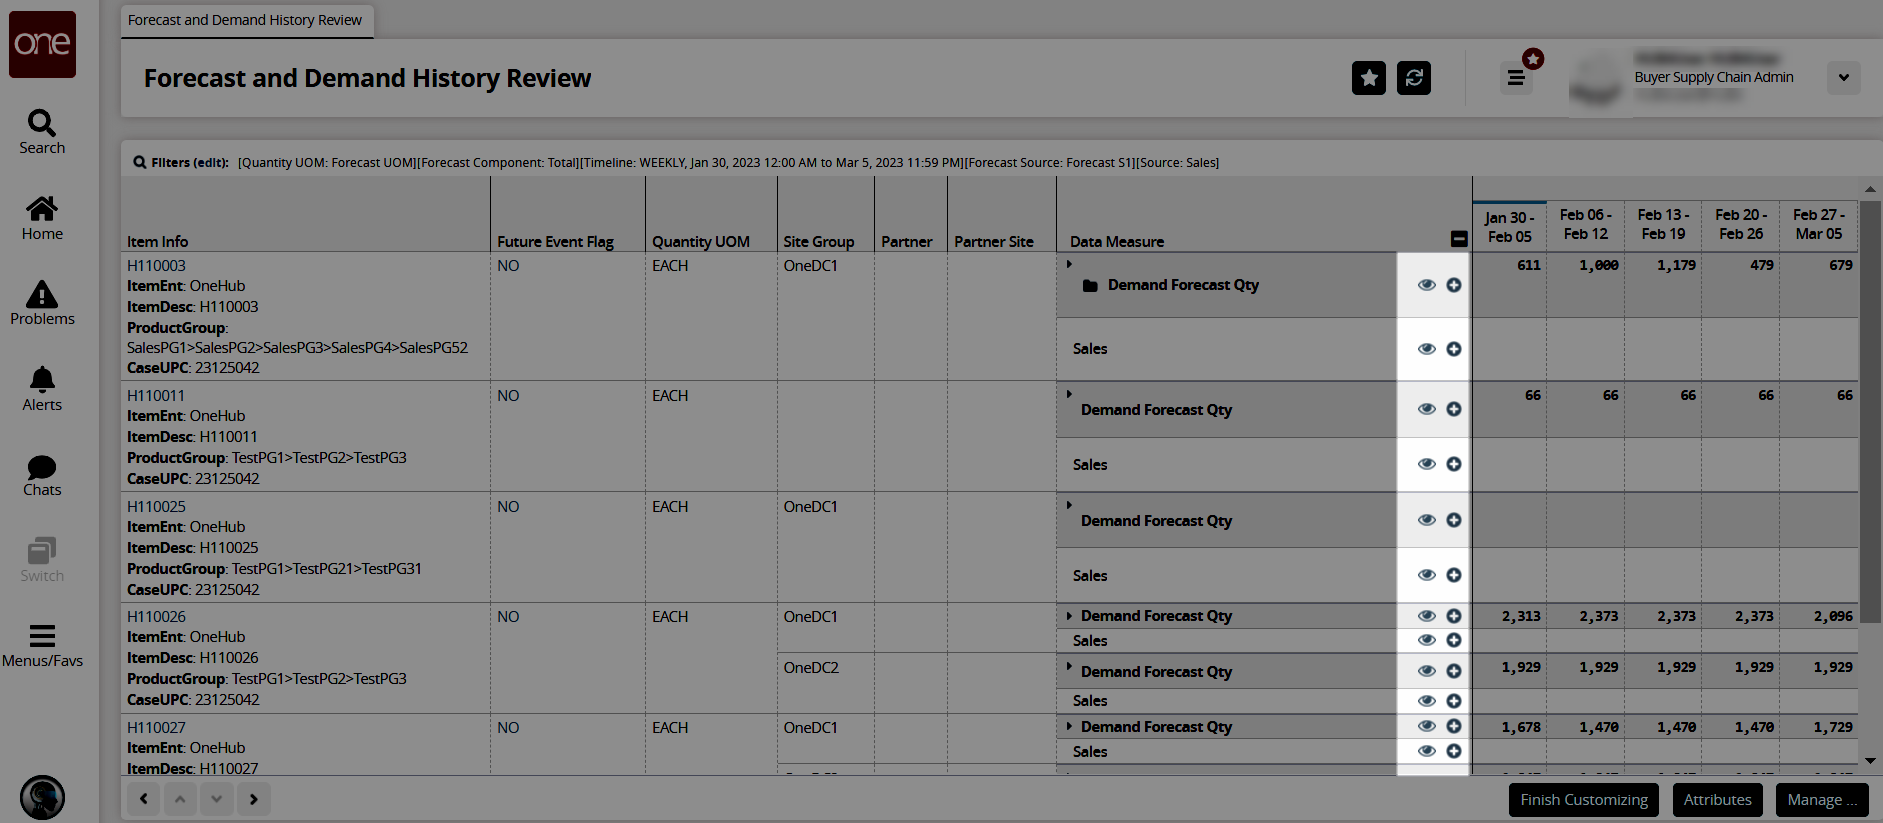
Click the eye icon to hide and unhide the data measure.
Click the plus icon and select an option to add a data measure above or below this data measure.
The Add Data Measure popup displays.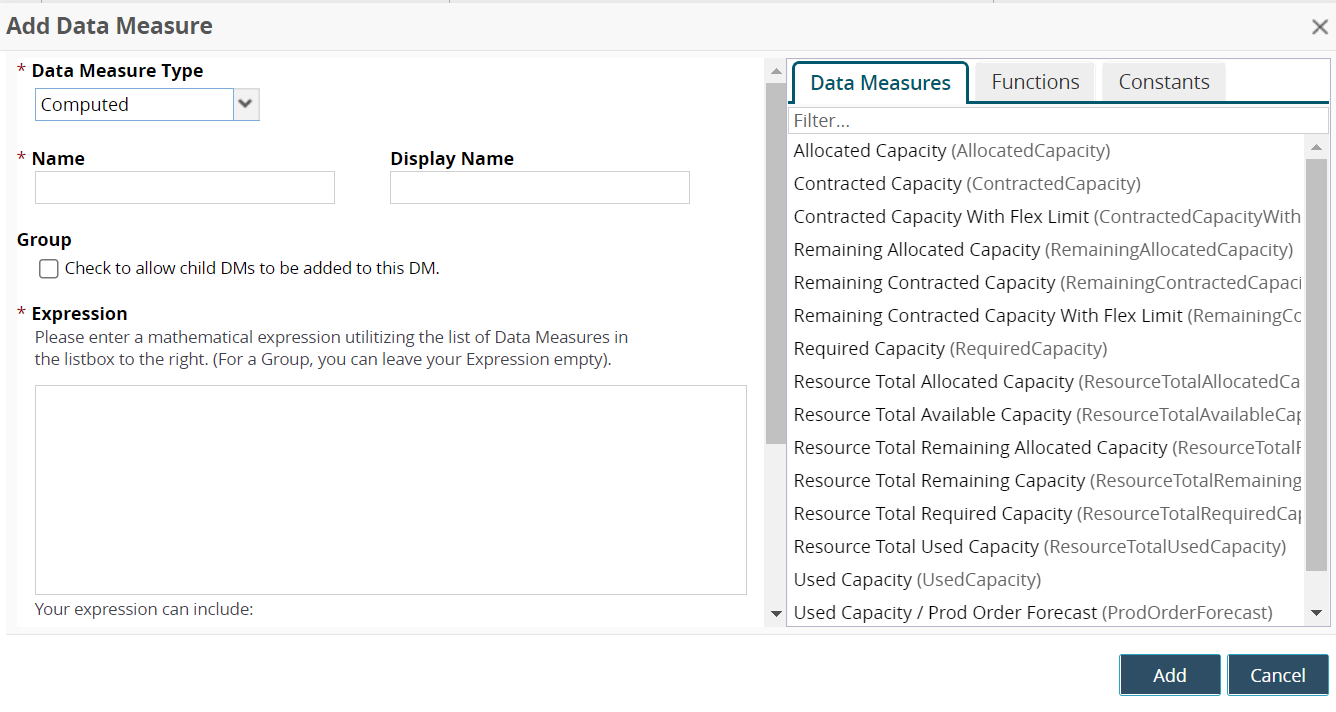
Fill out the following fields. Fields with an asterisk ( * ) are required.
Field
Description
* Data Measure Type
Select a data measure type from the dropdown menu.
* Name
Enter a name for the data measure
Display Name
Enter a different name to display on the report if desired.
Group
Check the box to allow child data measures to be added to this data measure.
*Expression
Click the tabs (Data Measure, Function, and Constants) in the pane on the right to build a mathematical expression from the lists. Instructions are provided for each tab.
Click the Add button.
The data measure is added as a new row.Click the Attributes button.
The Customize Attributes popup displays.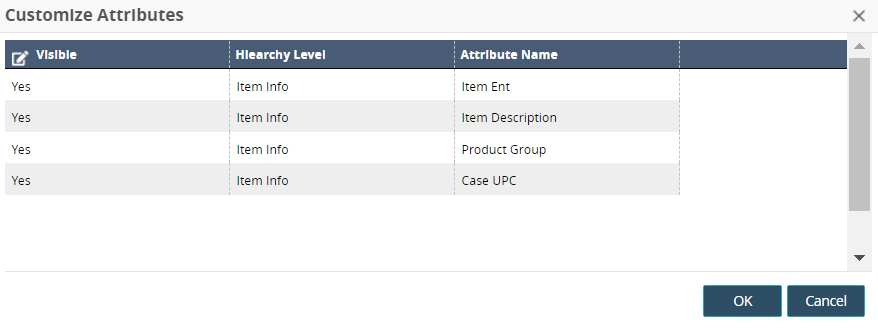
In the Visible column, click a cell and check or uncheck the box.
A check displays Yes, and no check displays No.Click the OK button.
The screen refreshes to display or hide your selections.Click the Manage button to display the added customizations in a new tab.
The Manage Customization screen appears in a new tab.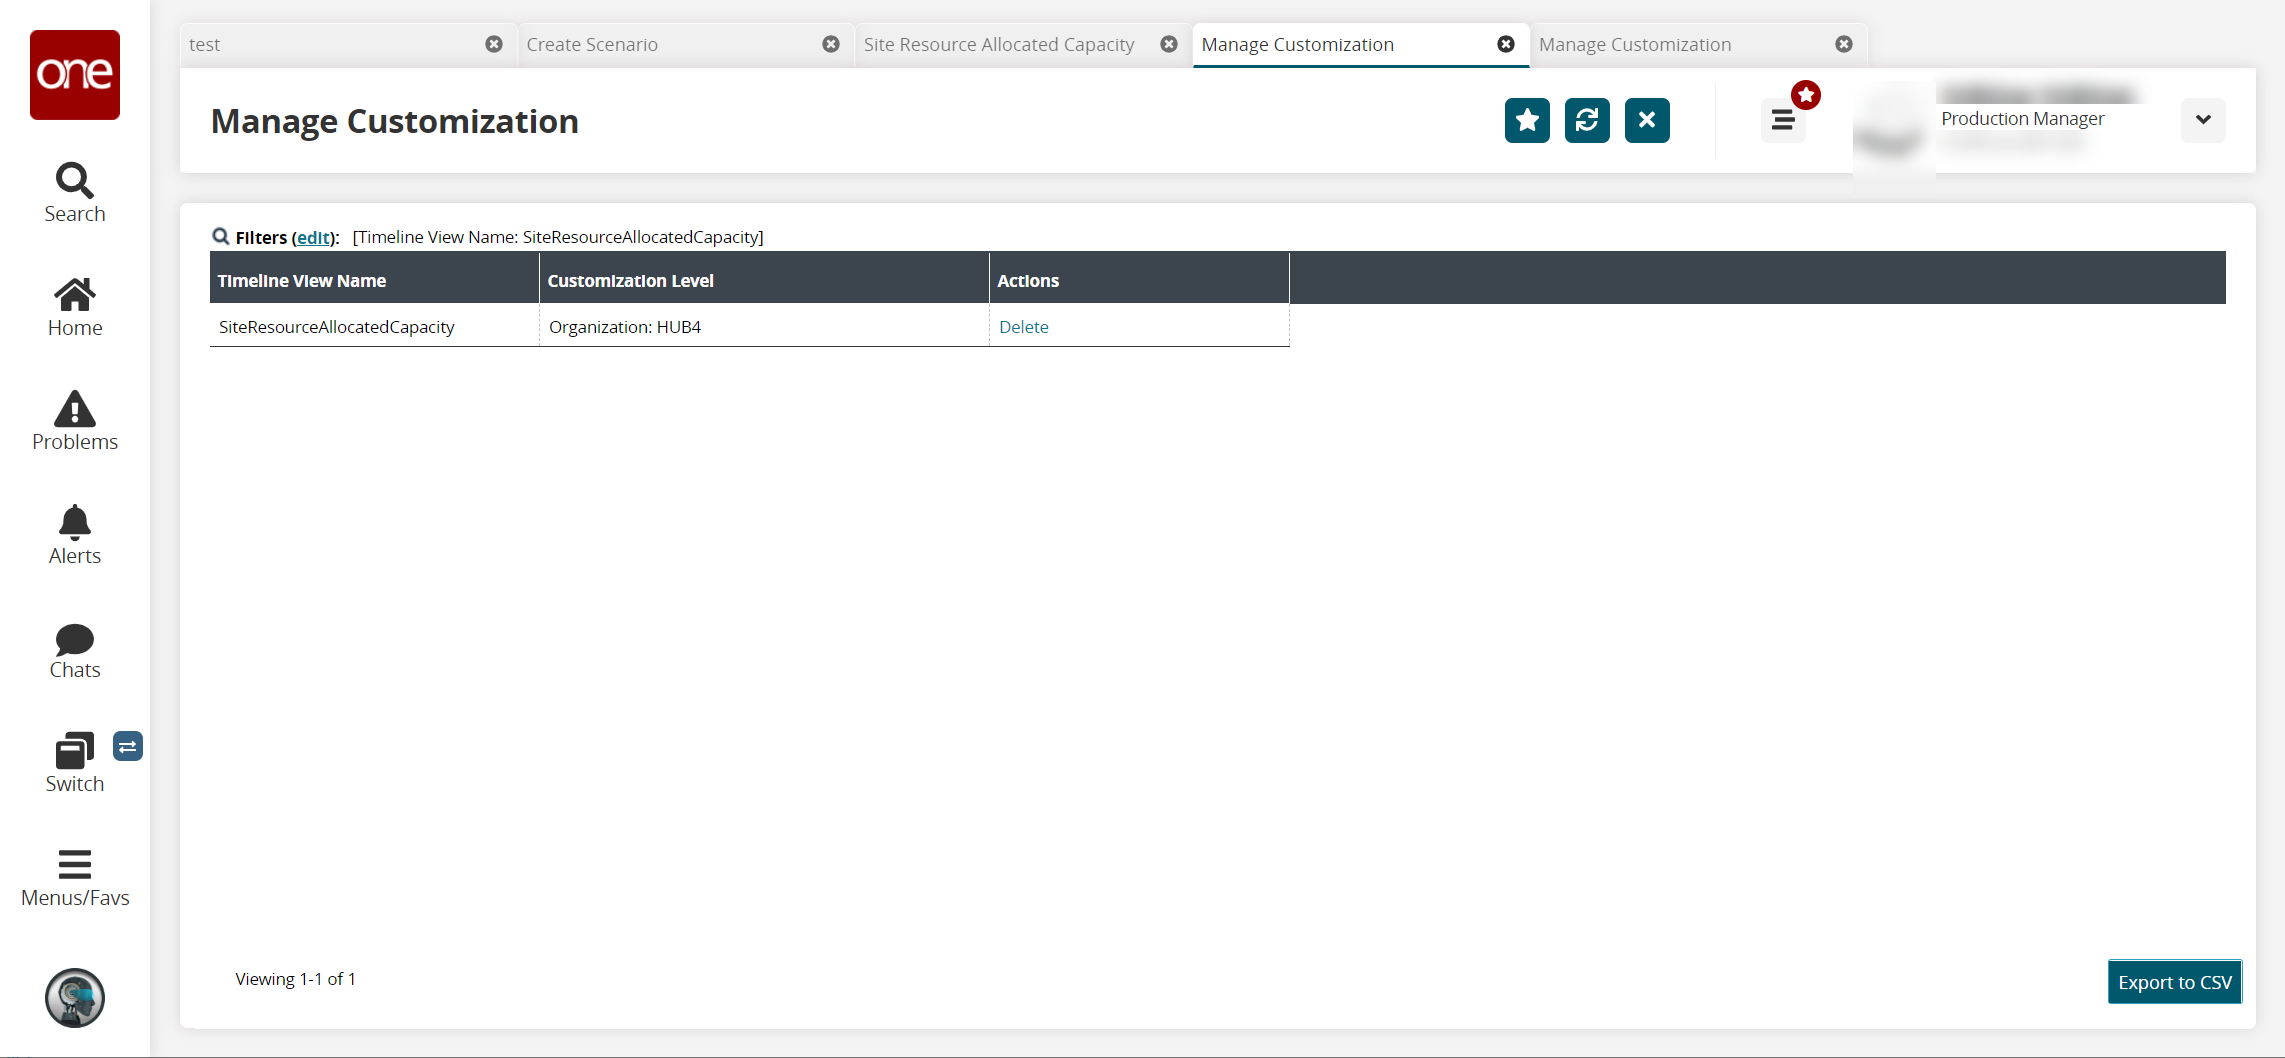
In the Actions column, click the Delete link to delete a customization.
Click the Export to CSV button to export the report to a CSV file.
Returning to the Forecast and Demand History Review screen, click the Finish Customizing button.
The TLV updates.Click the Save button.
The screen refreshes.Click the Export to Excel button to export the data to a file on your computer.