Tactical Planning
The Tactical Planning feature allows you to view reports of a weekly timeline view (TLV) of data measures for order forecasts, shipments, shipment lines, movements, and fleet resources. The reports can be viewed for a period of one or two weeks, with daily buckets and data measures captured on forecast orders from the distribution center.
There are several features that make up the Tactical Planning interface, including:
Filters for Site/Dock Door Group and Date Range
Data over 1 or 2-week time periods with daily buckets
Data measures on forecasted orders for the distribution center
Data measures for inbound shipments and movements
Data measures for outbound shipments and movements
Data measures for loading, picking, marshaling lane capacities (based on inflow/picking and outflow/loading from/to marshaling area for outbound DC loads), and dispatched fleet for outbound deliveries
Bulk-entry-based data measures, which are used in various data measure computations
Support for shift-based timeline data
Telescoping that allows the plan to be viewed by hours within a day
Data measures based on a pick location will be covered as a custom enhancement
Complete the following steps to view tactical planning reports:
L og in to the ONE system.
Select Menus/Favs > Scheduling > Project Capacity Views > Tactical Plan.
The Tactical Plan screen displays.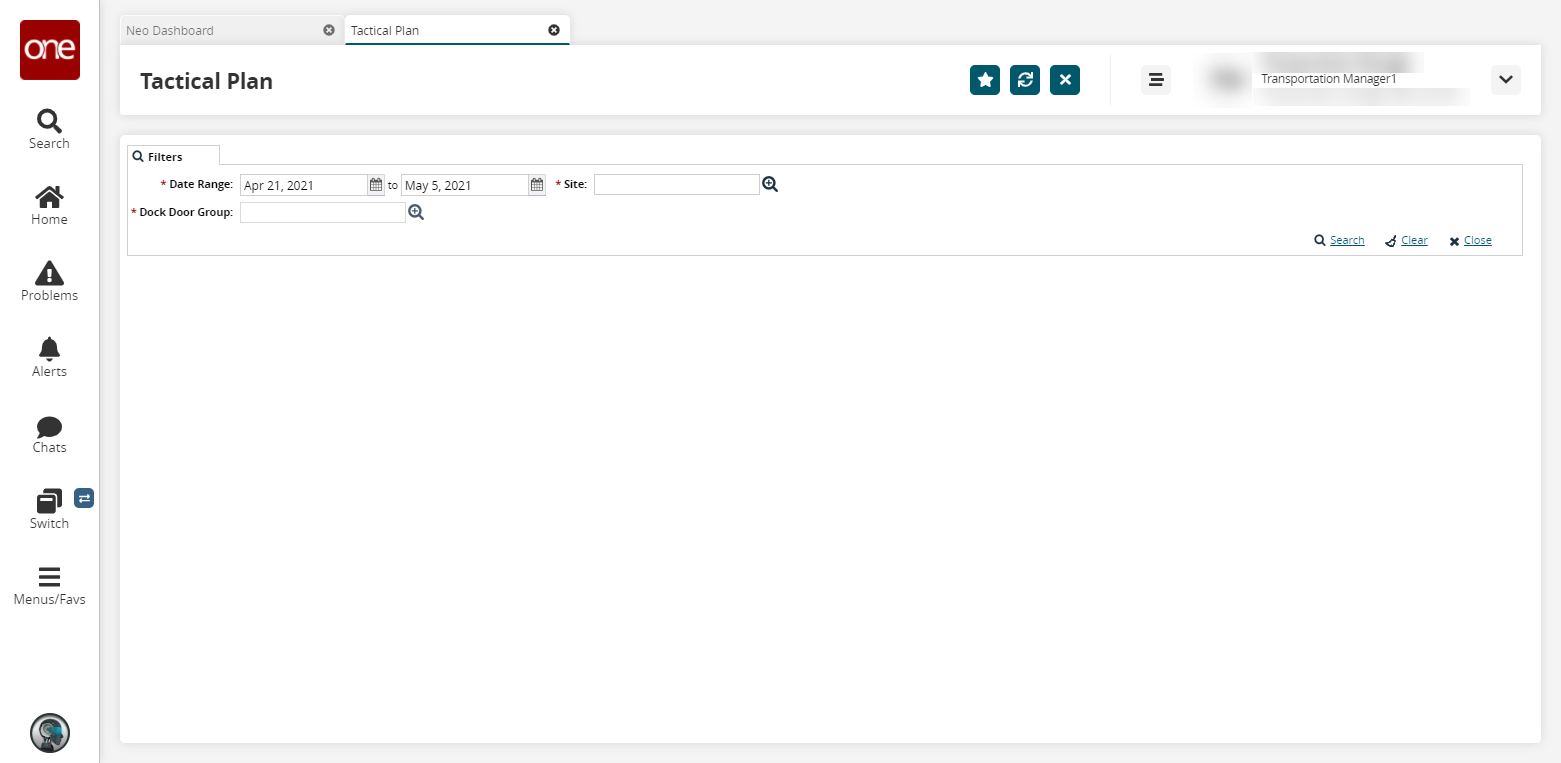
Enter a * Date Range using the calendar icons. Fields with an asterisk ( * ) are required.
Enter a * Site and a * Dock Door Group using the picker tool.
Click the Search link.
The Tactical Plan page displays.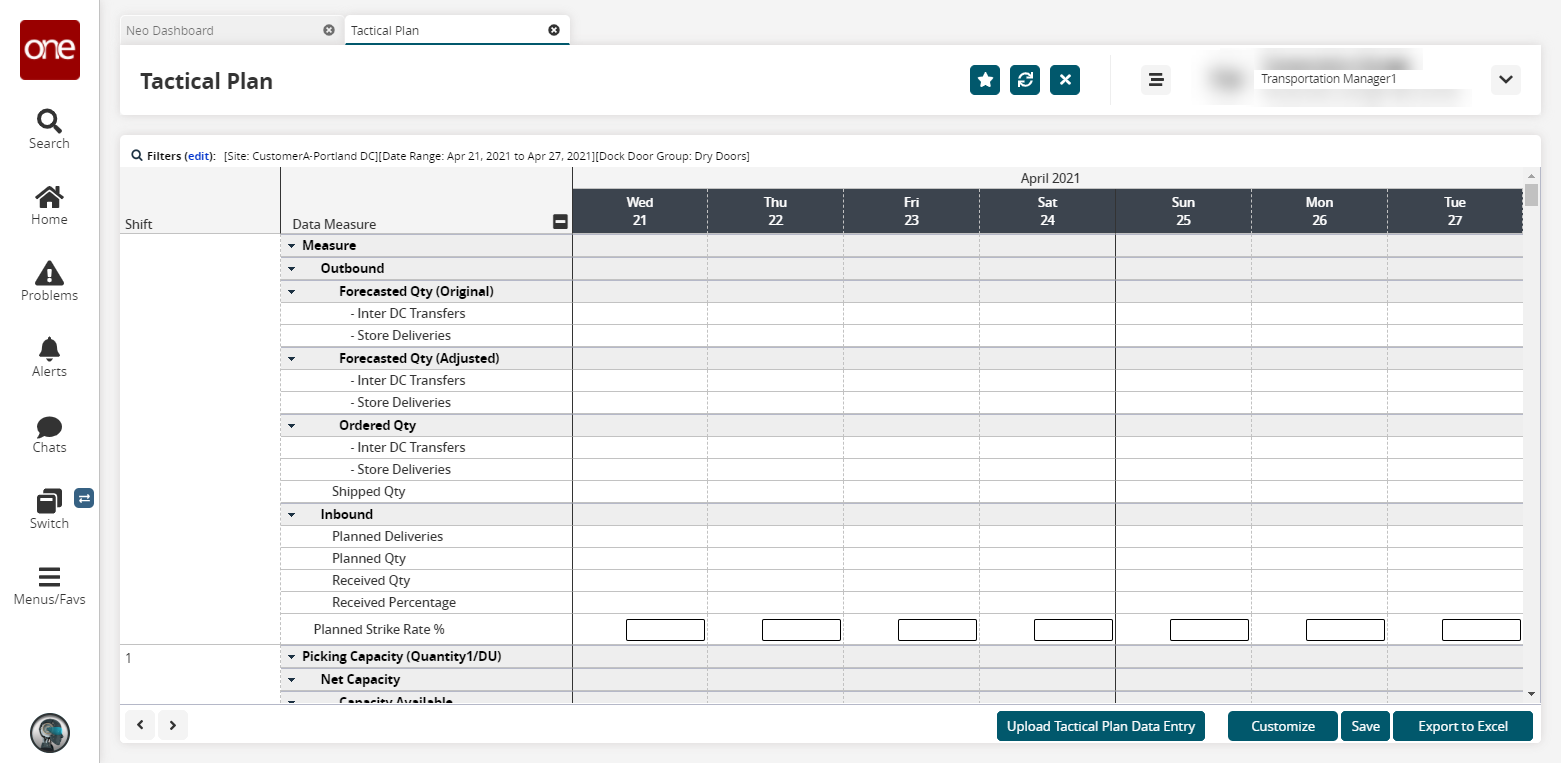
Click the Upload Tactical Plan Data Entry button to upload the values from a spreadsheet.
The file upload popup displays. See the "Uploading Files" section in the Online Help for more information.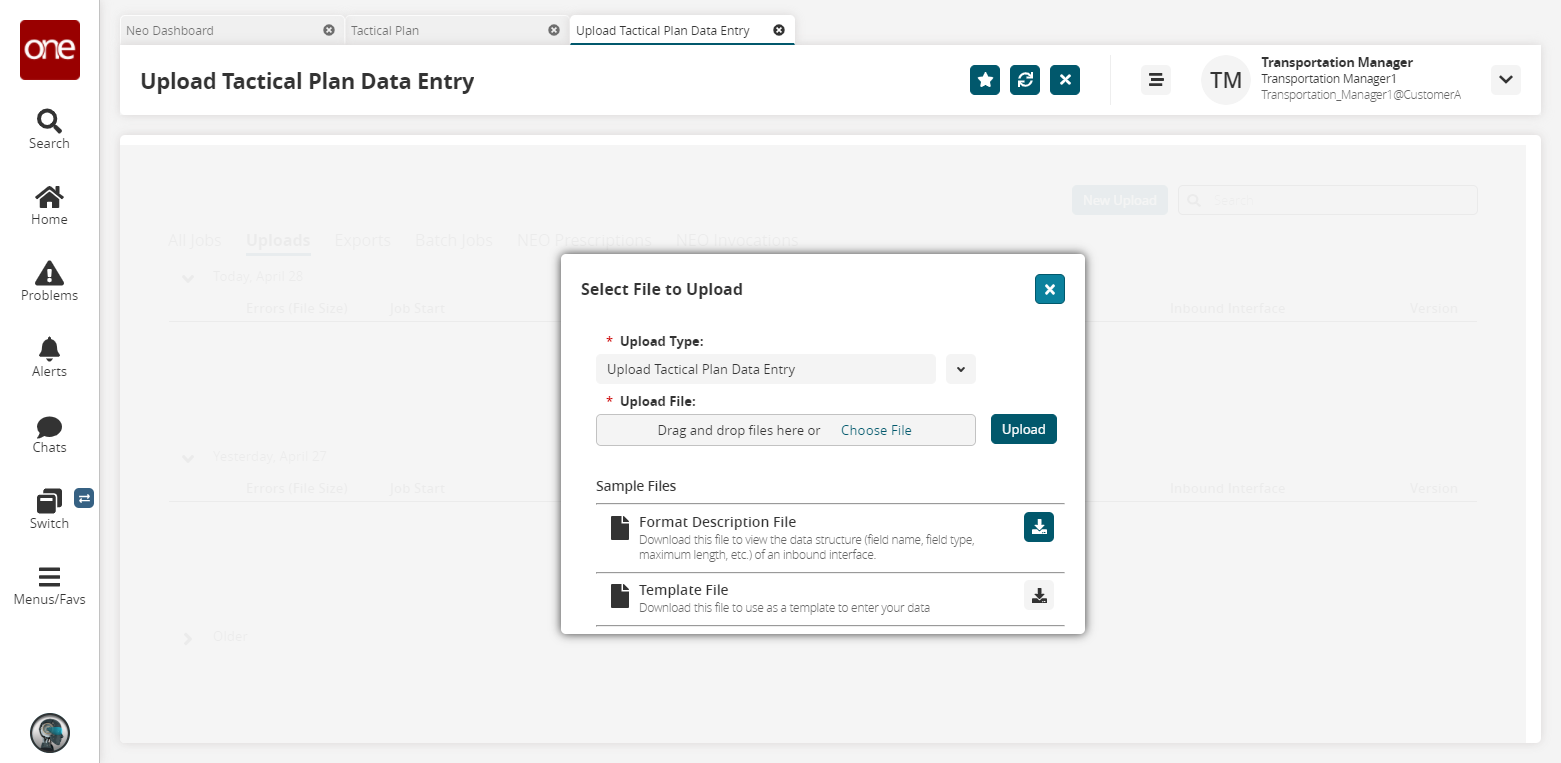
Click the Customize button to customize the data measure reports.
The Customization Level popup displays.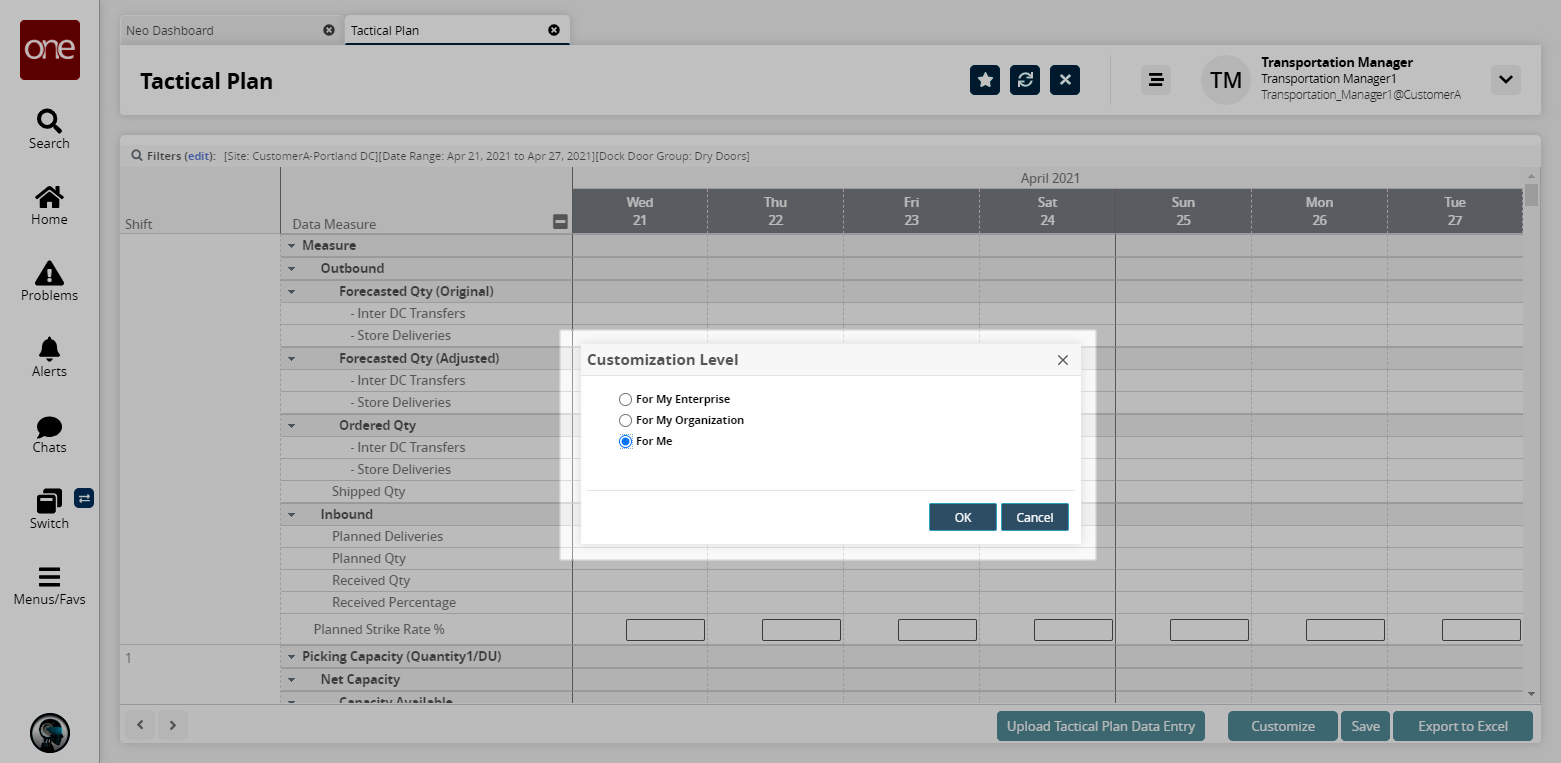
Select either For My Enterprise, For My Organization, or For Me.
Click OK.
Data measures become editable.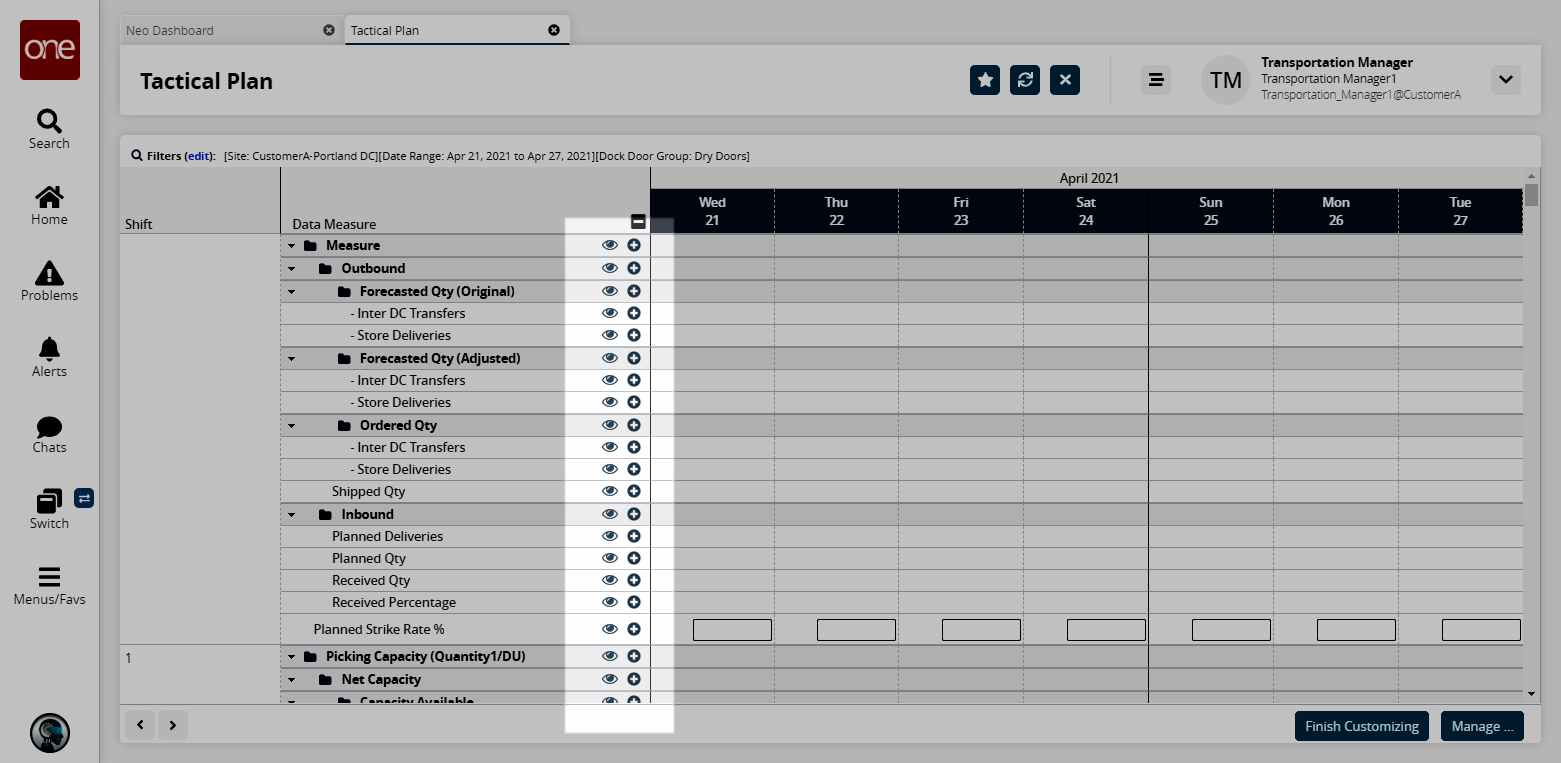
On the Data Measure column, you can drag the folder to arrange the flow.
Click the Add icon (plus sign) of the data measure where you want to add a new data measure, and then select an option: Add Data Measure Above or Add Data Measure Below.
The Add Data Measure popup box displays.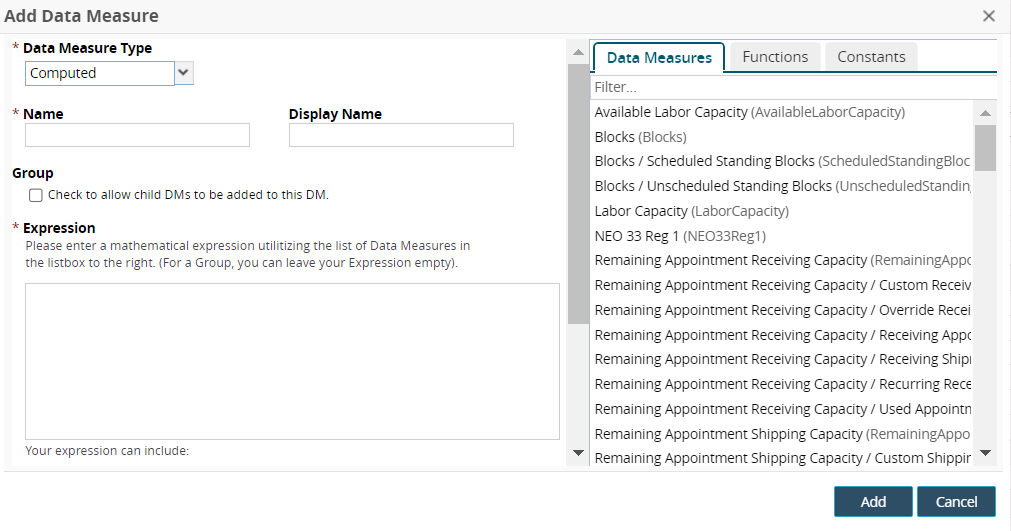
Fill out the following fields. Fields with an asterisk ( * ) are required.
Field
Description
* Data Measure Type
Select a data measure type from the dropdown list.
* Name
Enter a name for the data measure. Use either underscore characters instead of spaces between words in the name, as in Total_Capacity, or use camel case, as in TotalCapacity.
Display Name
Enter a display name displayed in the UI.
Group
Select this checkbox to allow child data measures to be added to this data measure.
* Expression
Create a mathematical expression using the appropriate elements. Click the available Data Measures, Functions, and Constants tabs to insert data measures and functions.
Data Measure references from the Data Measures tab
Numbers
Mathematical operators: +, -, *, /
Predefined functions from the Functions tab
Comparators: >, >=, =, <=, <
Parentheses
Click the Add button.
The new data measure displays. Options for user-created data measures also display deleting and editing icons.Click the eye icon to hide or make visible a data measure row.
Click the X icon to delete a user-created data measure.
Click the pencil icon to edit a user-created data measure.
The Edit Data Measure popup displays the same fields as adding a new data measure.
Complete the instructions as noted above.
Click the Finish Customizing button.
The customization icons are no longer visible.Click the Save button.
Click the Export to CSV button to export the report to a CSV file.
Note
Similarly, you can view Hourly Tactical Plan by navigating to Menus/Favs > Scheduling > Projected Capacity Views > Hourly Tactical Plan.