Working with All Summary Type Widgets
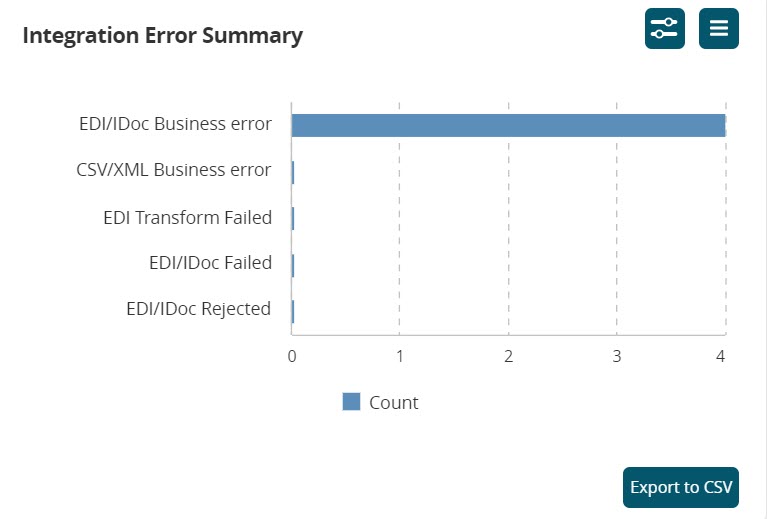
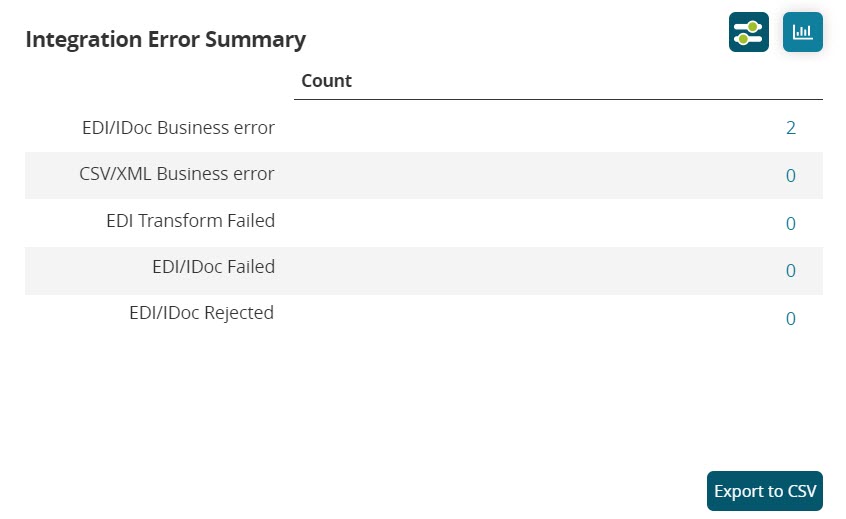
Many widgets in the ONE dashboards are based on a similar type for summary widgets. These widgets display a number of categories with the sum total of data in the category (orders, shipments, problems, etc.). Users can filter the data and toggle between a chart or table/text view. The example below uses the Integration Error Summary widget, as it is a common summary widget for many user roles in the system.
Complete the following steps to use a summary widget:
L og in to the ONE system.
The user role's assigned dashboard or custom dashboard displays on the screen. If the particular summary widget you need is not displayed on the dashboard, please see the "Adding Widgets" section in the Online Help for more information.
Click the active links for the category name along the y axis.
The report for that data point displays in a new tab.Click the bar for the data count.
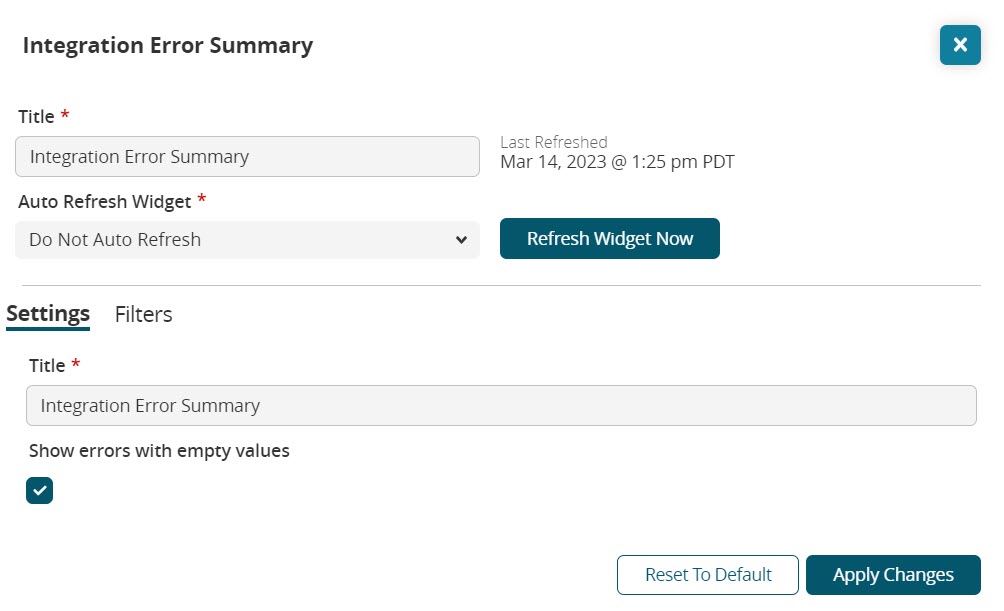
The report for that data point displays in a new tab.Click Filter Options button in the top right corner of the widget.
The settings popup window displays. For more information, please see the "Configuring Widgets" section of the Online Help for more information.
Click the Reset To Default icon to reset the filter options.
The original filter settings are applied to the data.Click the Apply Changes button.
The widget refreshes with the new filter options.Click the List View icon to toggle the widget's data to a list.
The widget's display changes to a list, and the icon changes to Chart View.
Click the Export to CSV button to export the report to a CSV file.