Working with Root Cause Analysis
The Root Cause Analysis feature for the Replenishment Service is one cohesive evaluation strategy. The key concept is understanding where we are today and how we got here. For example, knowing what the forecast was at the earliest order point (where we were) and what the forecast is today (where we are now). Root Cause Analysis is a combination of configurable engines that generate reports based on a large group of parameters.
Invoking the Buffer Accuracy Engine
Complete the following steps to invoke the Buffer Accuracy Engine:
Log in to the ONE system.
Click Menus/Favs > Replenishment > Accuracy > Invoke Buffer Accuracy Engine.
The Invoke Buffer Accuracy Engine screen appears.Select a date and time for Computation Date.
Use the picker tool to select an Item Enterprise and an Item.
Optionally, select a Site or Product Group Level, as desired.
Click the Run Engine button at the bottom of the screen.
The Job State section on the bottom portion of the screen lists a Job Id as well as a State, Job Results, and task information.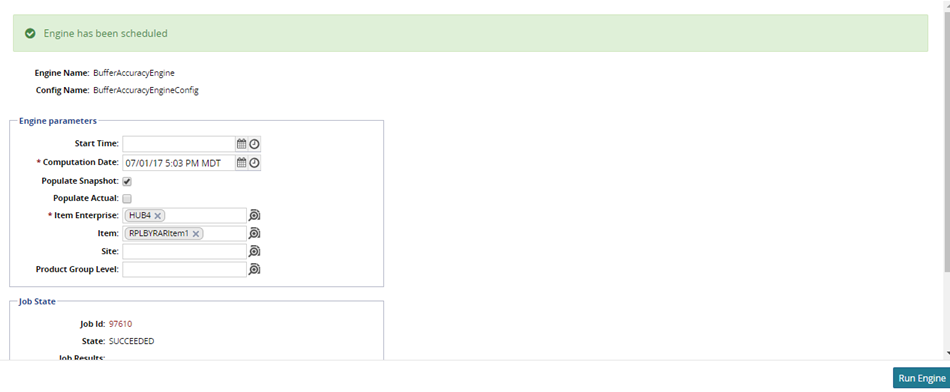
Invoking Root Cause Analysis
Complete the following steps to invoke the Root Cause Analysis Engine:
Log in to the ONE system.
Click Menus/Favs > Replenishment > Accuracy > Invoke Root Cause Analysis Engine.
The Invoke Root Cause Analysis Engine screen displays.Select a date and time for Computation Date.
Use the picker tool to select an Item Enterprise and an Item.
Optionally, select a Ship To Site or Product Group Level, as desired.
Click the Run Engine button at the bottom of the screen.
The Job State section on the bottom portion of the screen lists a Job Id as well as a State, Job Results, and task information.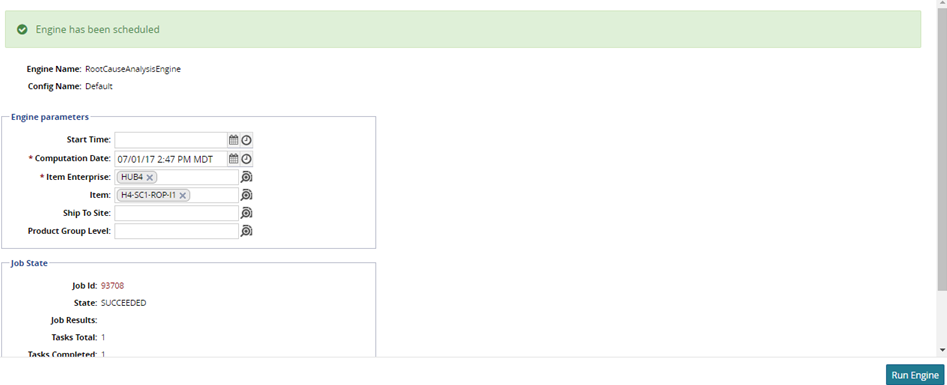
Viewing the Buffer Accuracy Report
Complete the following steps to view the Buffer Accuracy Report:
Log in to the ONE system.
Click Menus/Favs > Replenishment > Accuracy > Buffer Accuracy Report.
The Buffer Accuracy Report screen opens.Enter an Analysis Date Range for the report.
Select a Site or Item using the picker tool, as required.
After entering values for all desired filters, click the Search button. A list of results appears.
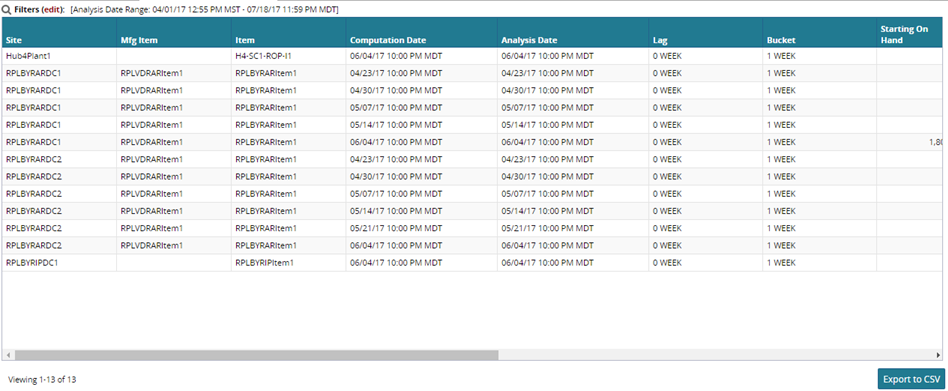
To export the results to a spreadsheet, click the Export to CSV button at the bottom of the page.
Viewing the Root Cause Analysis Report
Complete the following steps to view the Root Cause Analysis Report:
Log in to the ONE system.
Click Menus/Favs > Replenishment > Accuracy > Root Cause Analysis Report.
The Root Cause Analysis Report screen displays.Enter an Analysis Date range for the report.
Use the table below to enter more filter information for the report.
Field Name
Description
Supply In Excess Of Safety Stock < 0
Select Yes to include supply in excess of safety stock less than 0. To exclude this parameter, select No.
Supply Demand Ratio > (%)
Shows supply-demand ratio greater than the entered value (percentage).
Supply Demand Safety Stock Ratio > (%)
Shows supply-demand safety stock ratio greater than the entered value (percentage).
Safety Stock Coverage > (%)
Shows safety stock coverage is greater than the entered value (percentage).
Out Of Stock
Select Yes to include items that are out of stock. To exclude this parameter, select No.
Demand Variability <=
Shows demand variability less than or equal to the entered value.
Forecast Variability <=
Shows forecast variability less than or equal to the entered value.
Supply Variability <=
Shows supply variability less than or equal to the entered value.
On Hand Variability <=
Shows on-hand variability less than or equal to the entered value.
Supply In Excess Of Demand < 0
Select Yes to include supply in excess of demand less than 0. To exclude this parameter, select No.
Supply Demand Ratio <= (%)
Shows supply-demand ratio less than or equal to the entered value (percentage).
Supply Demand Safety Stock Ratio <= (%)
Shows supply-demand safety stock ratio less than or equal to the entered value (percentage).
Safety Stock Coverage <= (%)
Shows safety stock coverage is less than or equal to the entered value (percentage).
Lost Sales
Select Yes to include lost sales. To exclude this parameter, select No.
Safety Stock Violation
Select Yes to include safety stock violations. To exclude this parameter, select No.
Demand Variability >
Shows demand variability greater than the entered value.
Forecast Variability >
Shows forecast variability greater than the entered value.
Supply Variability >
Shows supply variability greater than the entered value.
On Hand Variability >
Shows on-hand variability greater than the entered value.
After entering values for all desired filters, click the Search button. A list of results appears.
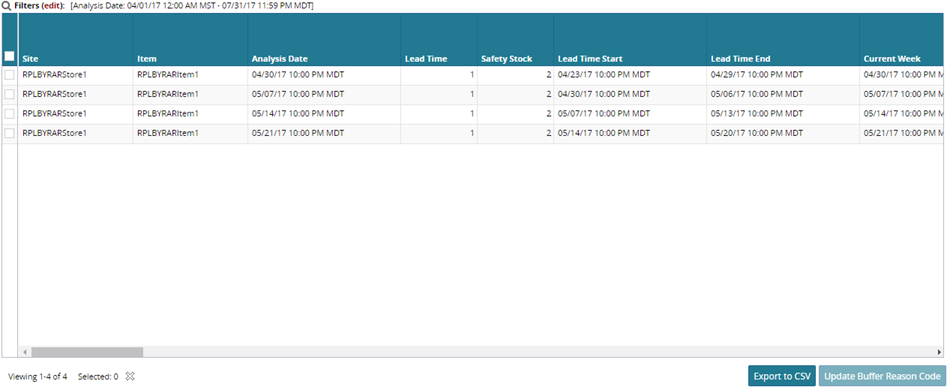
To update the buffer reason code for a line, click the checkbox at the beginning of the line, and click the Update Buffer Reason Code button at the bottom of the screen.
The Reason Code field becomes editable.Select a reason code, and click the Submit button to save any changes.
To export the results to a spreadsheet, click the Export to CSV button at the bottom of the page.
Viewing the Combined Accuracy Report
Complete the following steps to view the Combined Accuracy Report:
Log in to the ONE system.
Click Menus/Favs > Replenishment > Accuracy > Combined Accuracy Report.
The Combined Accuracy Report screen displays.Enter a Computation Date Range for the report.
Select a DC or Item using the picker tool, as required.
After entering values for all desired filters, click the Search button. A list of results appears.
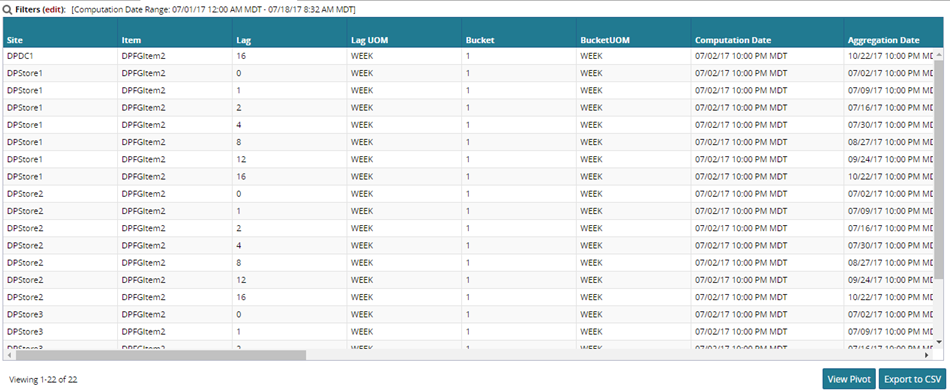
To view a pivot chart for the results, click the View Pivot button at the bottom of the page.
To export the results to a spreadsheet, click the Export to CSV button.