Creating A Custom Analytic Widget
Custom Analytic widgets allow users to create highly-customized widgets by selecting the
data subset and then selecting and tailoring the data presentation in a table or one of many
available charts. The functionality mirrors the pivot table/chart functionality that many
reports offer in the ONE system, but offers the additional benefit of constant visibility to the
data from the dashboard. This set of instructions covers the basic creation of a Custom
Analytic widget at a high level.
Complete the following steps to create a custom analytic widget:
Log in to the ONE system.
Click the Edit the Dashboard button. (Users may need to navigate to the correct dashboard first.)
The dashboard's edit mode displays.Click the Add Columnar Layout or the Add Fixed Layout buttons to add a new section to the dashboard, if necessary.
Click the plus sign to add a new widget.
The Add a (Fixed or Flexible) Widget popup window appears with Default Widgets displayed.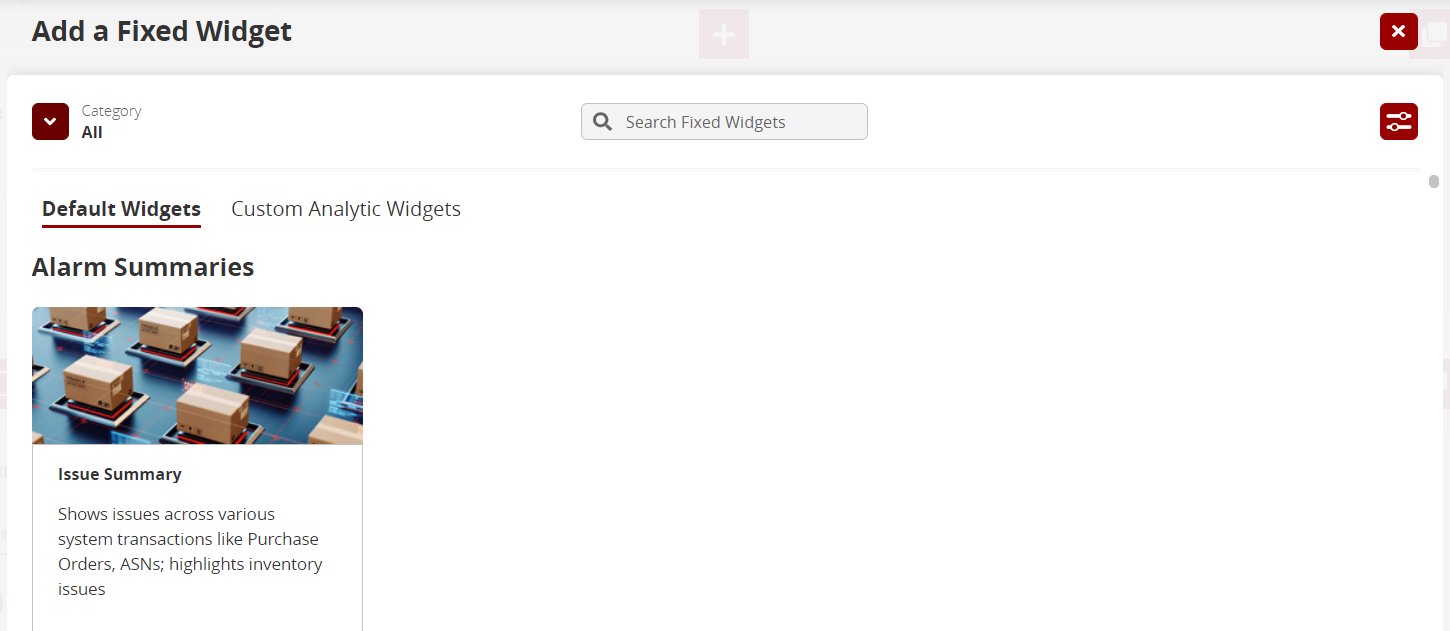
Click the Custom Analytic Widgets link.
A Create a Custom Analytic Widget banner appears.Click Create.
The Create a Widget screen displays.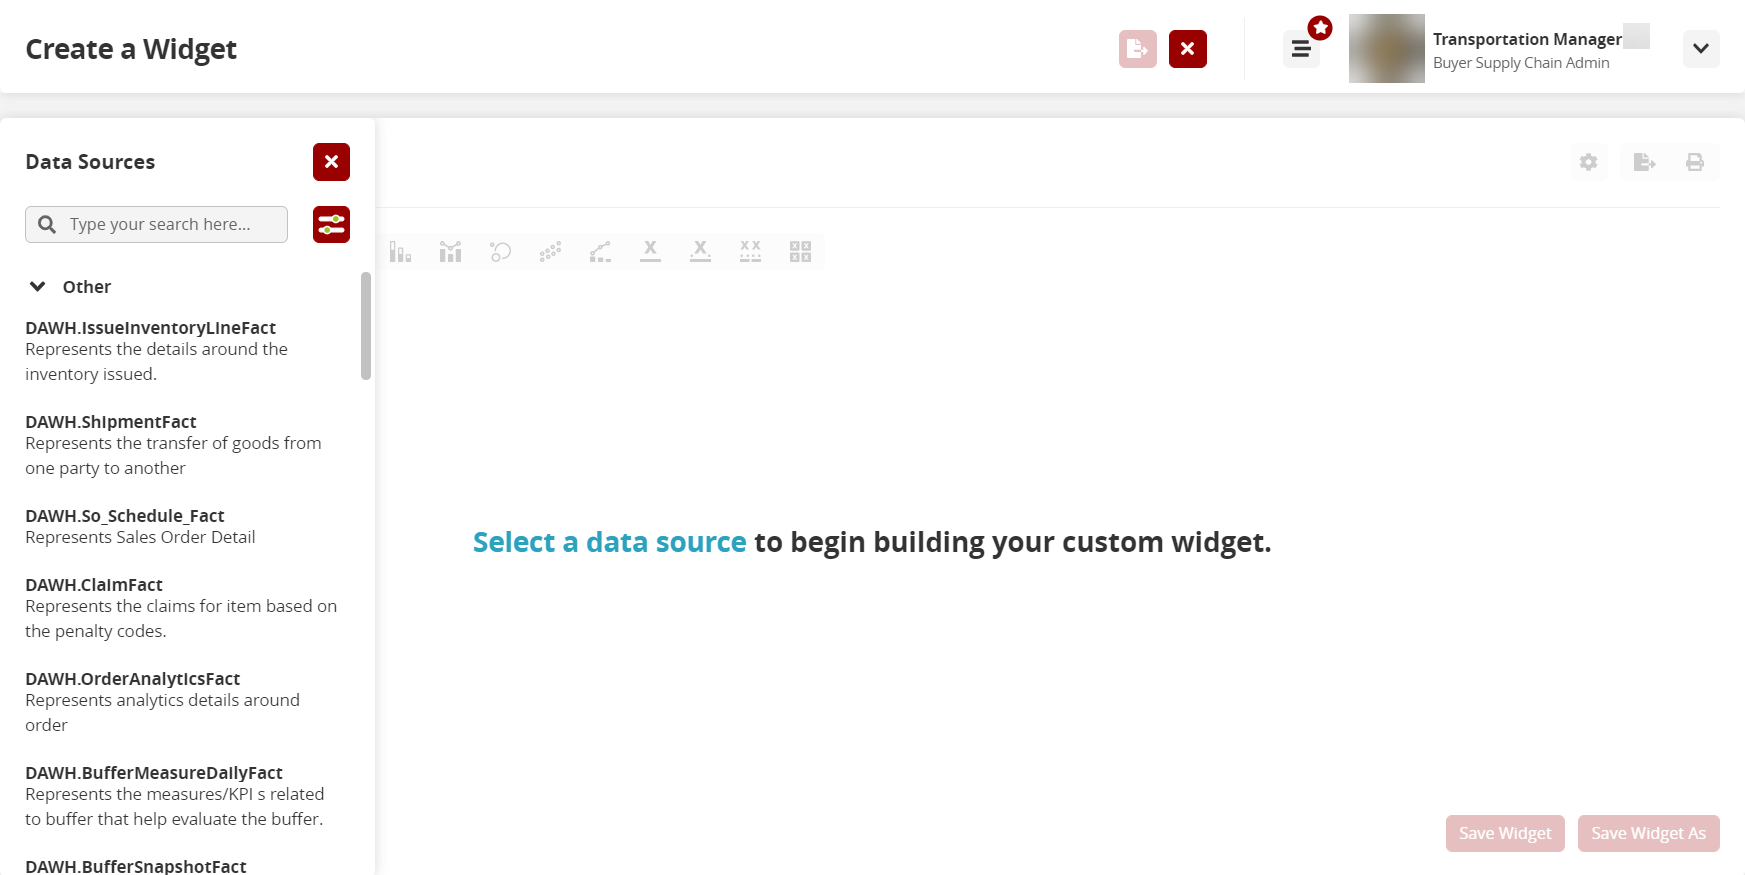
Click on a data source from the left pane of the screen.
The screen updates with the widget workbench. The data source can be changed
by clicking on the list button in the upper right of the workbench.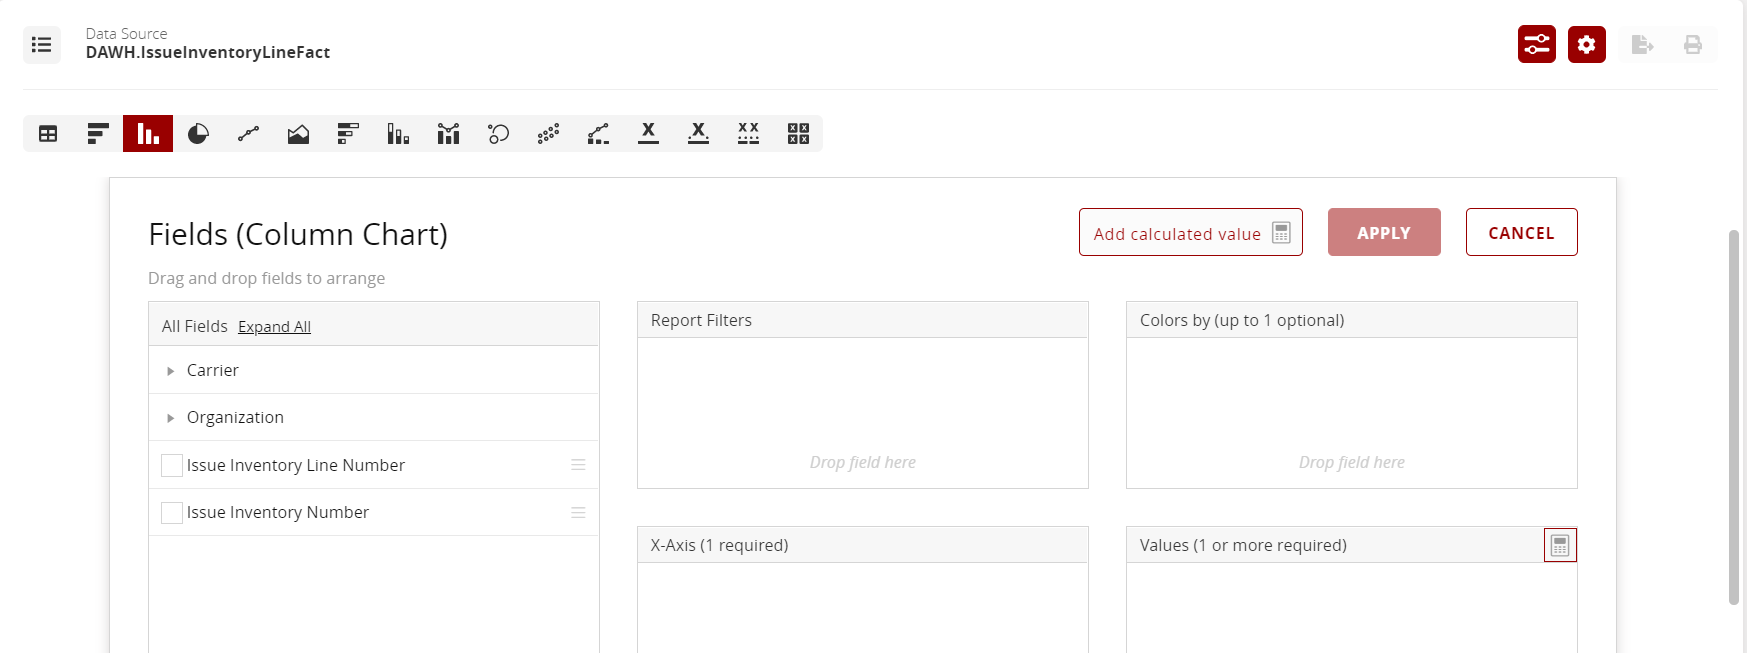
Select a chart type from the bar of chart icons. Tooltips display to identify each
chart type.
The chart type displays in parenthesis on the customization panel and the boxes
update based on the chart type.Click the Expand All link to display all fields associated with the data.
Click the field checkboxes to select them for the X-Axis.
Drag and drop fields to Report Filters, Colors by, or Values boxes as required.
Click the Add calculated value button if a formula is required.
The Calculated Value popup window displays.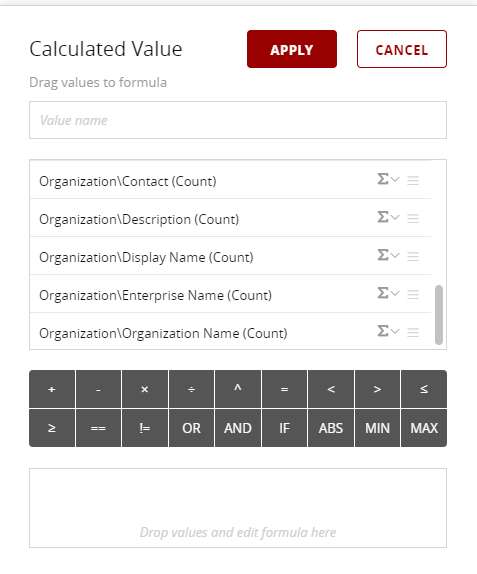
Drag field names and expressions to the bottom box to create a formula.
Click Apply.
The Calculated Value popup window closes.Click Apply.
Dropdown menus for further customization display. These menus will vary based on the chart. Some charts may not offer further customization and no menus will appear.
Select a value from the Chart Colors dropdown menu.
Select a value from the Measure dropdown menu.
Click the Save Widget As button to name this widget.
A popup displays.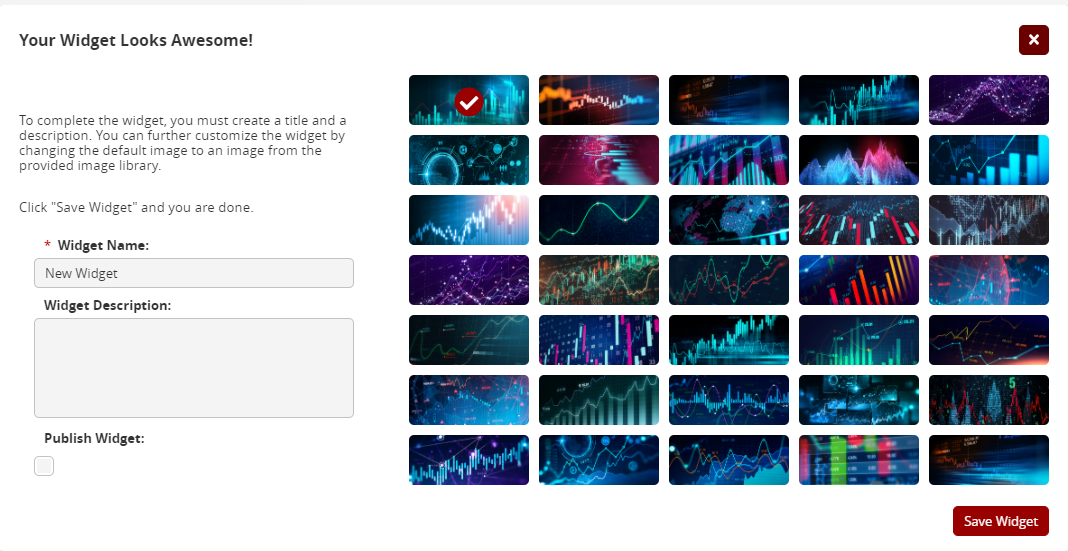
Note: Fields with an asterisk ( * ) are required.Enter a widget name in the * Widget Name field.
Enter a description for the function of the widget in the Widget Description field.
Check the Publish Widget box if you want this widget to be published for other users to subscribe and use the widget.
Click the graphic for the widget that displays in the Add a Widget popup.
Click Save Widget.
The Custom Widget Created popup displays.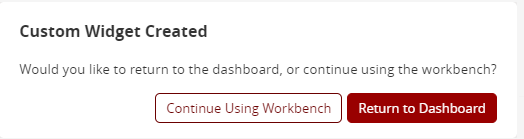
Click the Continue Using Workbench button to continue customizing this widget.
Click the Return to Dashboard button to return to the Add a Widget popup.
The new widget displays in the popup. Published and unpublished widgets are separated.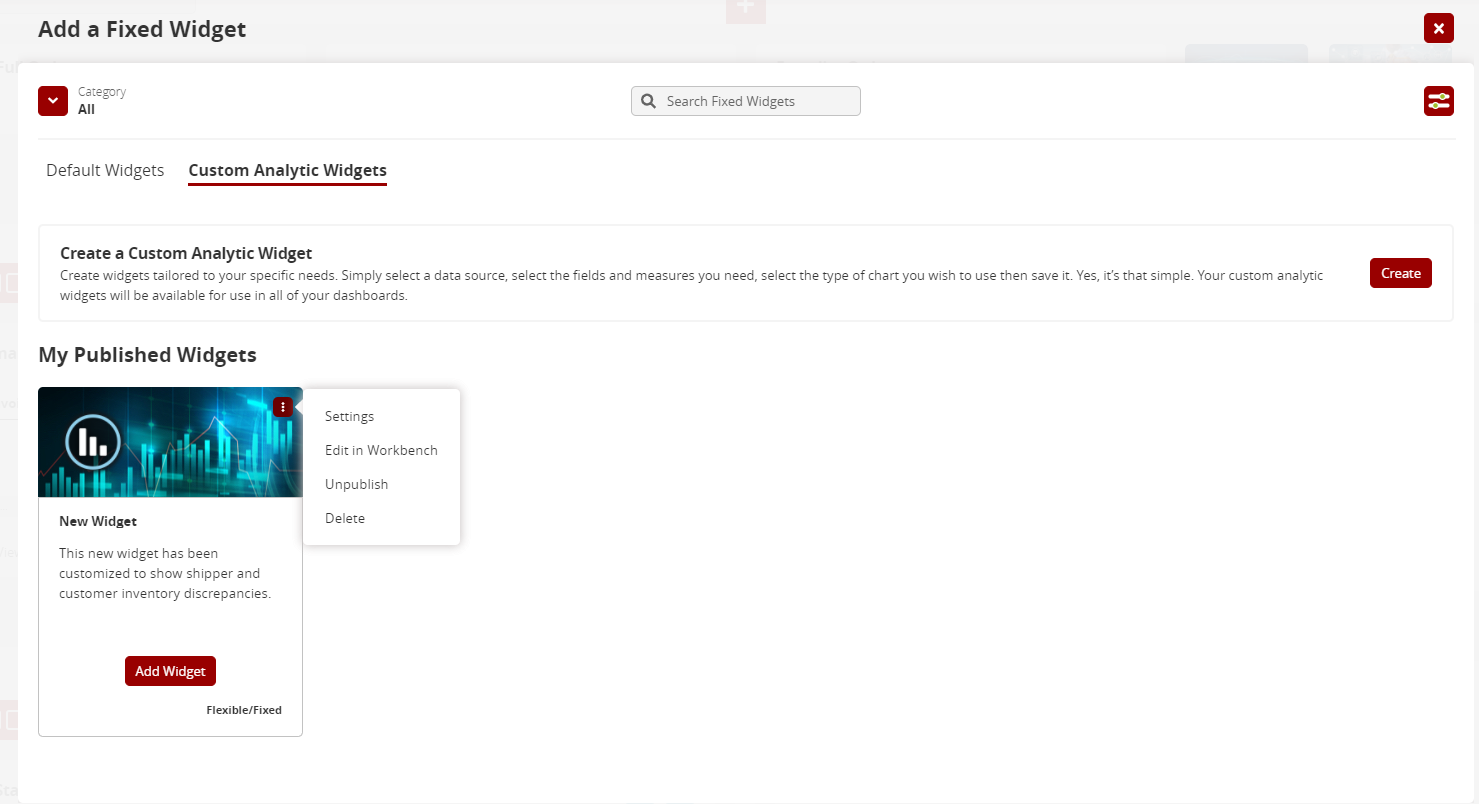
Click the three buttons in the top right corner of the widget display.
A menu displays.
A. Click the Settings link to return to the popup window to change the title, description, or graphic.
B. Click the Edit in Workbench link to return to the Create a Widget customization screen and widget workbench.
C. Click the Publish/Unpublish link to change the publication status that allows other users to subscribe to the widget.
D. Click the Delete link to delete this widget.Click the Add Widget button.
The new widget displays in the edit mode of the dashboard.Click the Save the Dashboard button.
The new widget displays in the dashboard.