Working With The Root Cause Analysis Widget
The Root Cause Analysis widget shows a 3-week summary of the values calculated by the
root cause engine. The widget shows the number of site and item combinations that are out
of stock or have demand variability for either the current week or the previous weeks. Some
fields, which are configurable, display quantities or percents and can provide negative
quantities (when supply < demand) and percents less than zero (again, supply < demand).
Please see the "Adding Widgets" section in the Online Help for more information on adding
this widget to your dashboard.
Complete the following steps to configure this widget:
Log in to the ONE system.
Click on the Filter Options of the Order Allocation widget.
The Filter Options popup window displays. Fields with an asterisk ( * ) are required.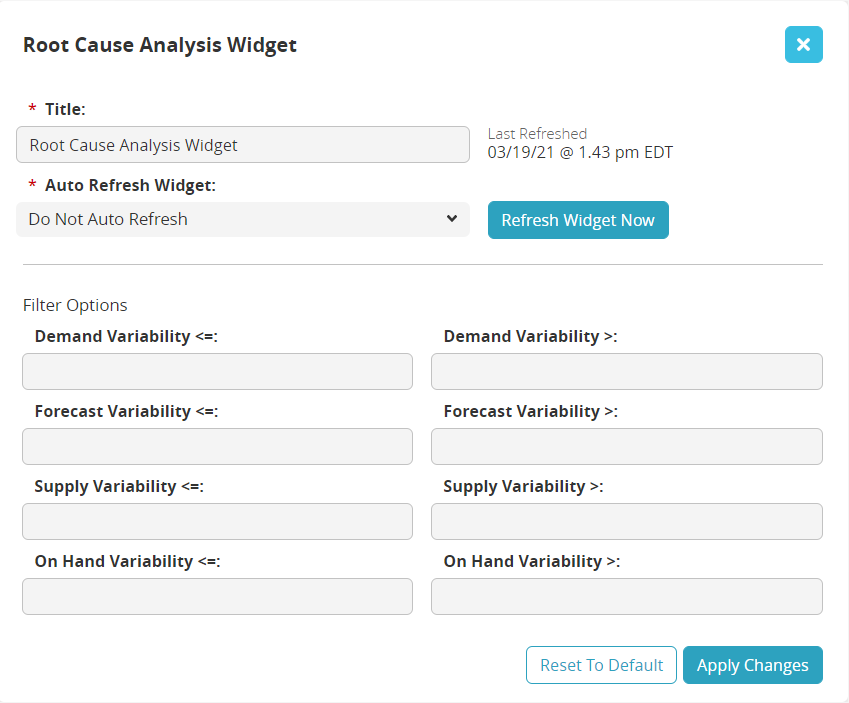
Modify the text in the * Title field for customization.
Select the duration for the system to refresh the widget from the * Auto Refresh Widget dropdown menu.
Complete the following fields with a formula to display the desired data:
Field
Formula Description
Demand Variability <=
Enter a value to show a less than or equal to result.
Demand Variability >
Enter a value to show a greater than result.
Forecast Variability <=
Enter a value to show a less than or equal to result.
Forecast Variability >
Enter a value to show a greater than result.
Supply Variability <=
Enter a value to show a less than or equal to result.
Supply Variability >
Enter a value to show a greater than result.
On Hand Variability <=
Enter a value to show a less than or equal to result.
On Hand Variability >
Enter a value to show a greater than result.
Click the Apply Changes button to apply the filter to the widget.
The widget refreshes with the new filter options.