Viewing Totals and Grand Totals in Custom Analytic Widgets
Users can view totals and grand totals in the tooltips of chart visualizations in custom analytic widgets.
Complete the following steps to view the new information:
L og in to the ONE system.
Click the Edit button (pencil) on the dashboard.
Click the plus sign in one of the sections to add a widget.
The Add a Fixed (or Flexible) Widget popup displays.Click on the Custom Analytic Widgets tab.
Click on the Create button.
The Create a Widget screen displays with the Data Sources popup displays.Select a data source.
The Fields (Column Chart) popup displays by default.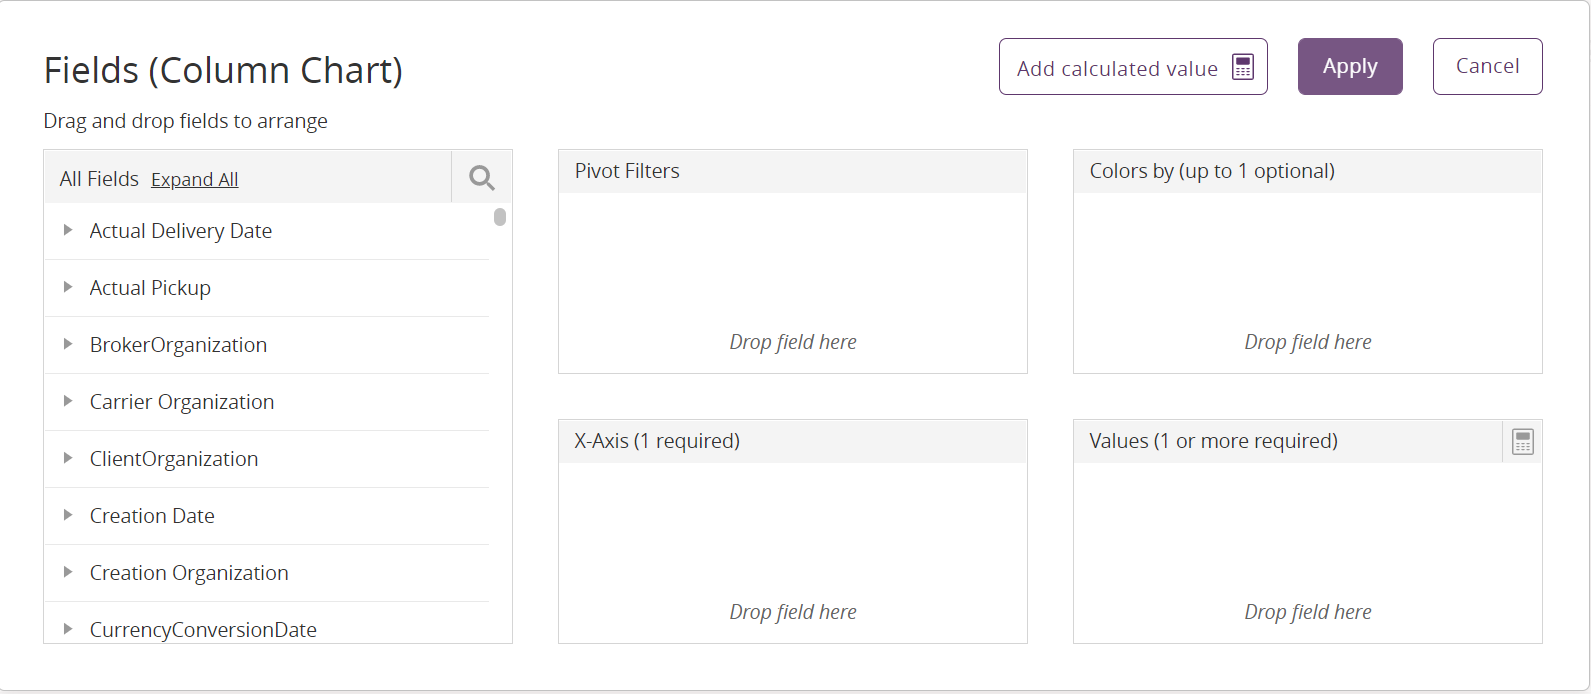
Select from the Fields section for data display from the left section for the X-Axis (this is for a column chart) and Values sections. Please see the "Adding and Creating a Custom Analytical Widget" section in the Online Help for more information.
Click the Apply button.
The Create a Widget screen with visualizations and customizations displays.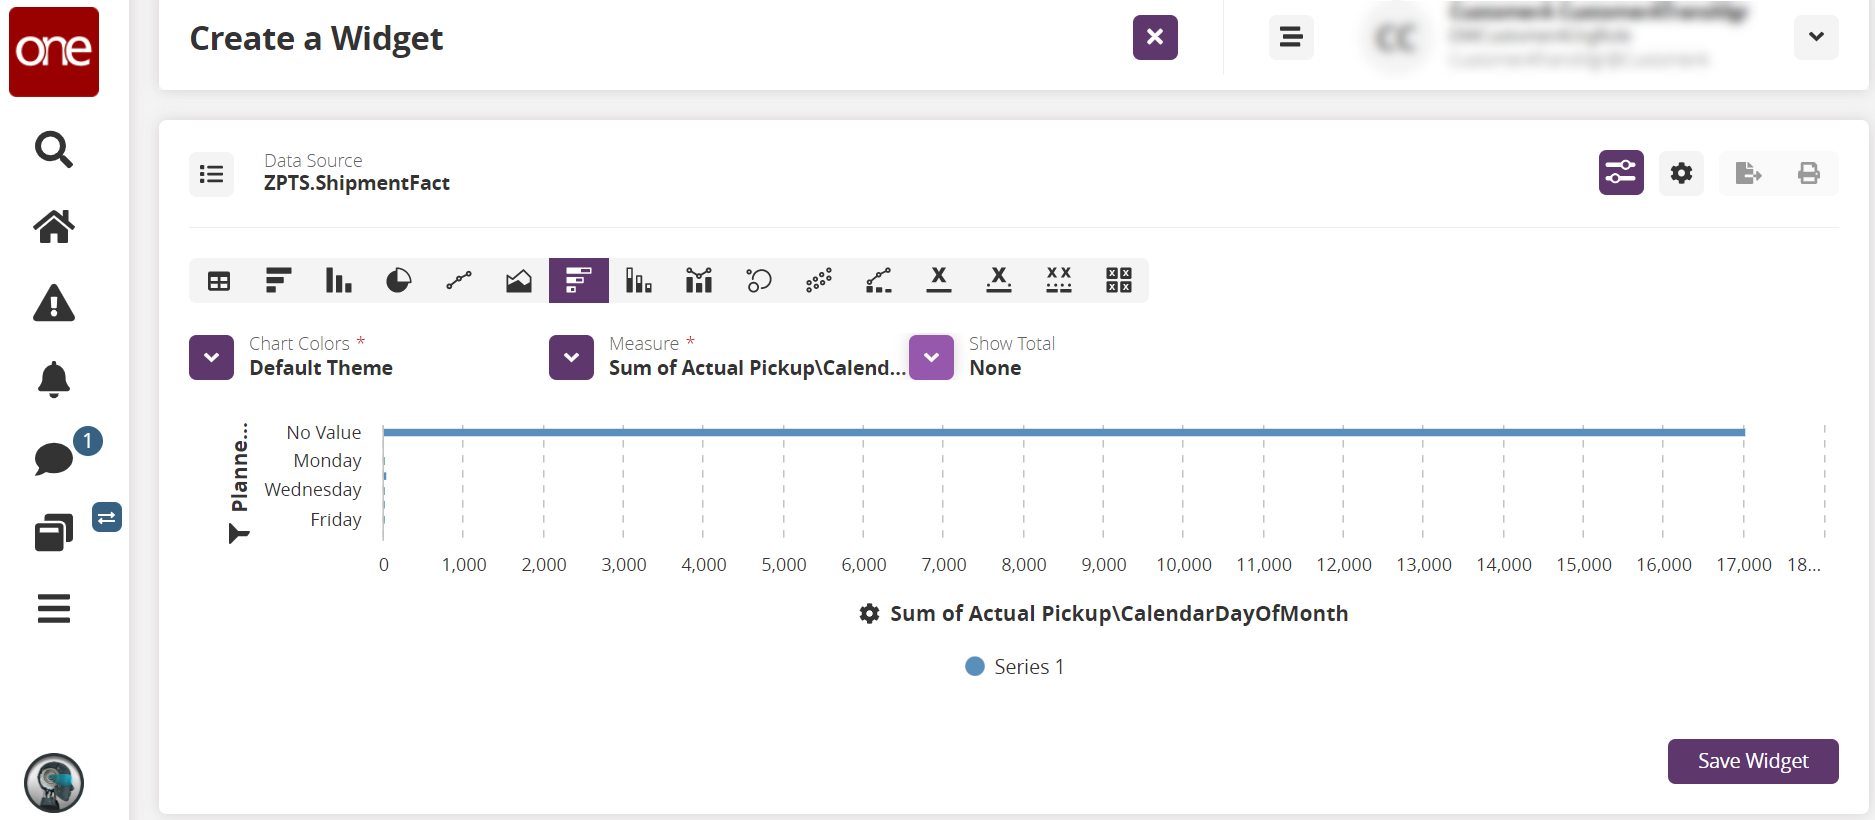
Select the visualization (chart type), Chart Colors * , and Measure * as required. Fields with an asterisk ( * ) are required. The screenshot below shows a stacked bar chart and changes the axis to a Y-axis view.
Click the Show Total dropdown arrow.
A menu displays options for Total By X, where X is the value selected in the axis section, and Grand Total.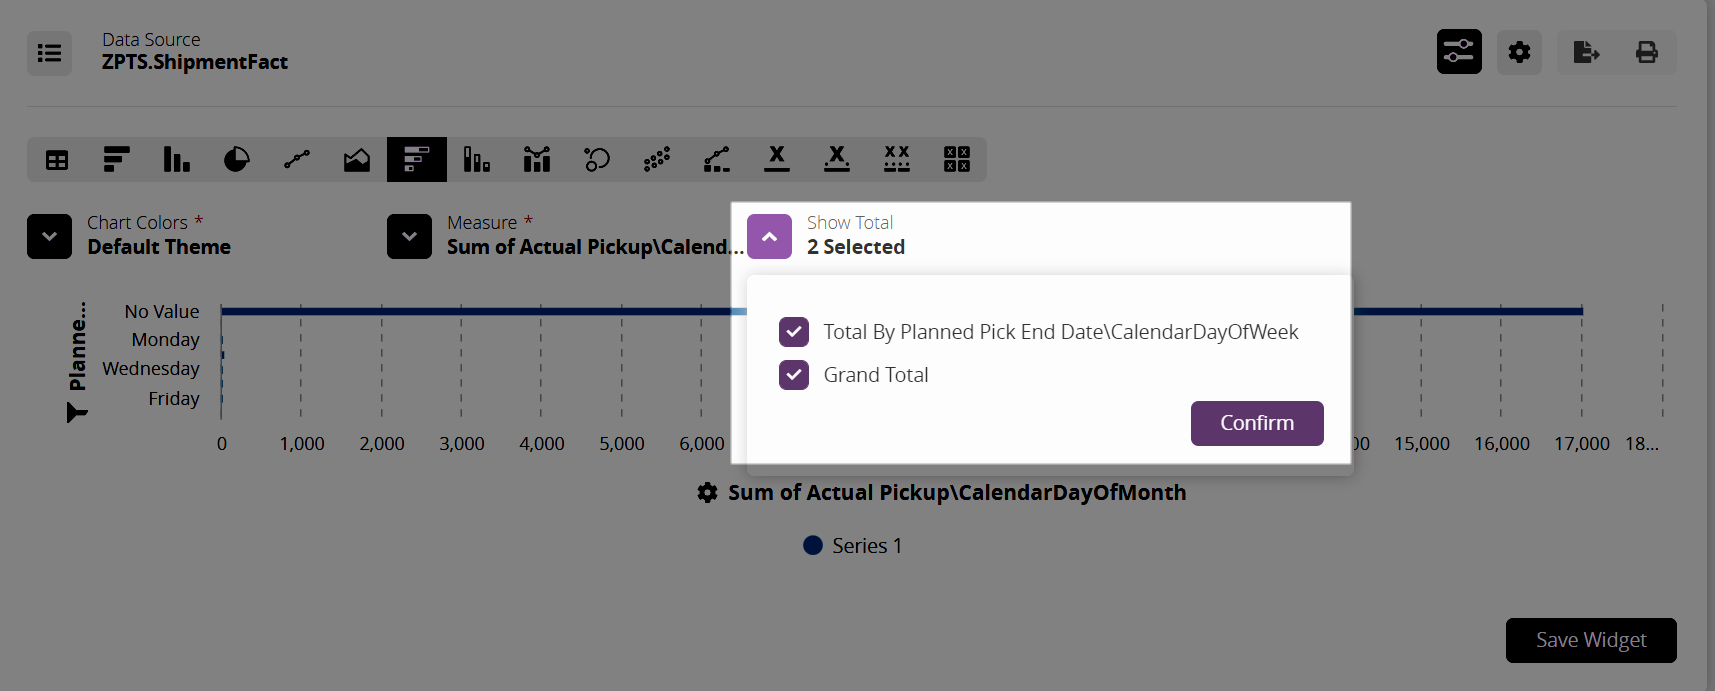
Check the boxes to display this data in a tooltip.
Click the Confirm button.
The chart refreshes.Hover your mouse on a data point.
The tooltip now shows the selected values.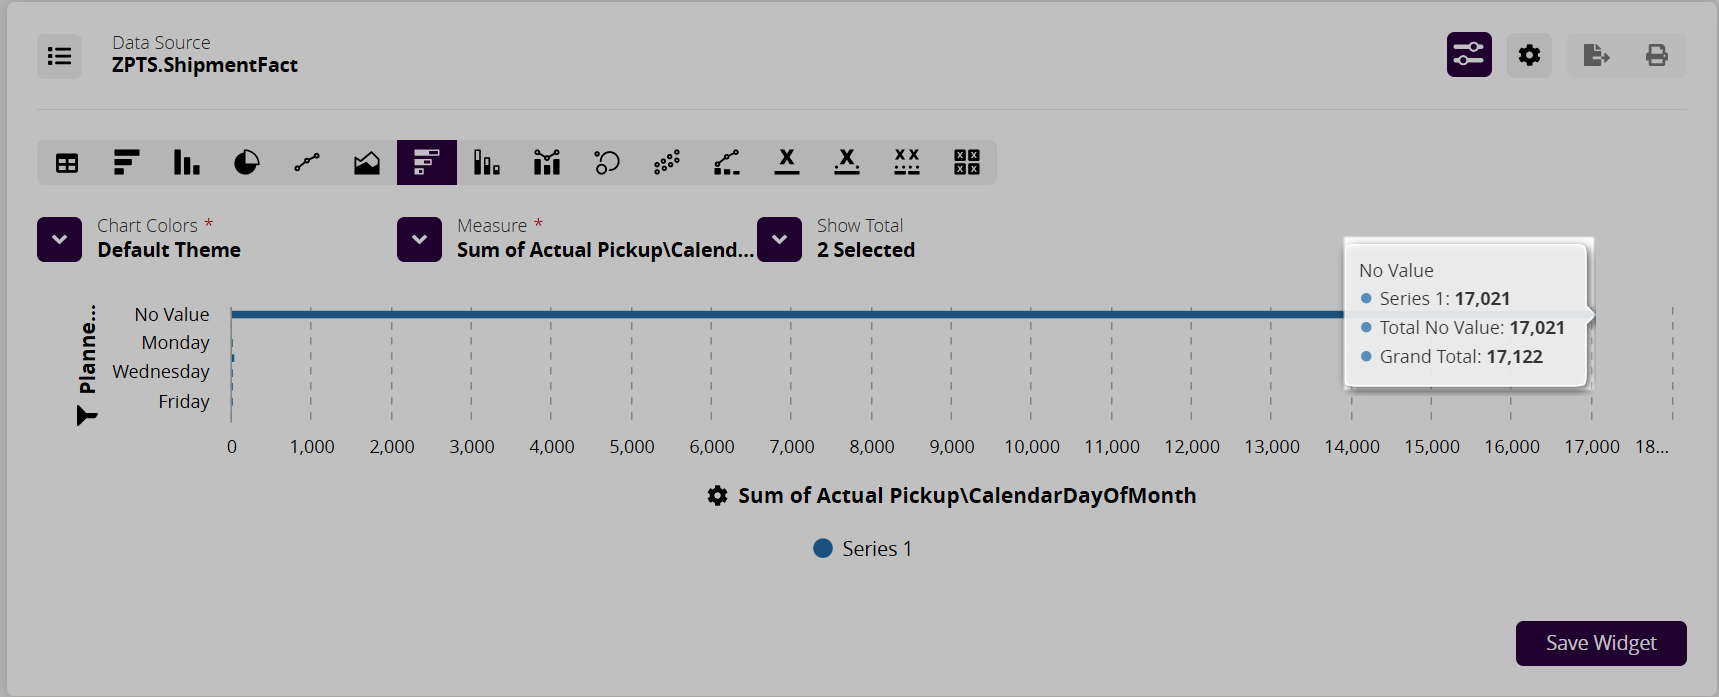
Users can save and customize further per normal steps as shown in the "Adding and Creating Custom Analytic Widgets" section.