Working with the Integration Error Summary Widget
Many widgets in the ONE dashboards are based on a similar type for summary widgets. These widgets display a number of categories with the sum total of data in the category (orders, shipments, problems, etc.). Users can filter the data and toggle between a chart or table/text view. Please see the "Working with All Summary Type Widgets" section in the Online Help for generic instructions.
The Integration Error Summary widget aggregates failures of integration files such as EDI, IDOC, CSV, and XML. Errors can occur for various reasons, including the following:
Business errors: This error is generated by the actions workflows. For example, a provided item is incorrect or an order already exists in the system.
Adapter errors: This error is generated while parsing the file. For example, a mandatory field like an item name or order line number has not been provided.
Structure errors: This error is generated while validating the file structure. For example, additional columns in the CSV file or EDI structure are not in the standard format.
Complete the following steps to use the Integration Error Summary widget:
L og in to the ONE system.
The user role's assigned dashboard or custom dashboard displays on the screen. If the widget is not displayed on the dashboard, please see the "Adding Widgets" section in the Online Help for more information.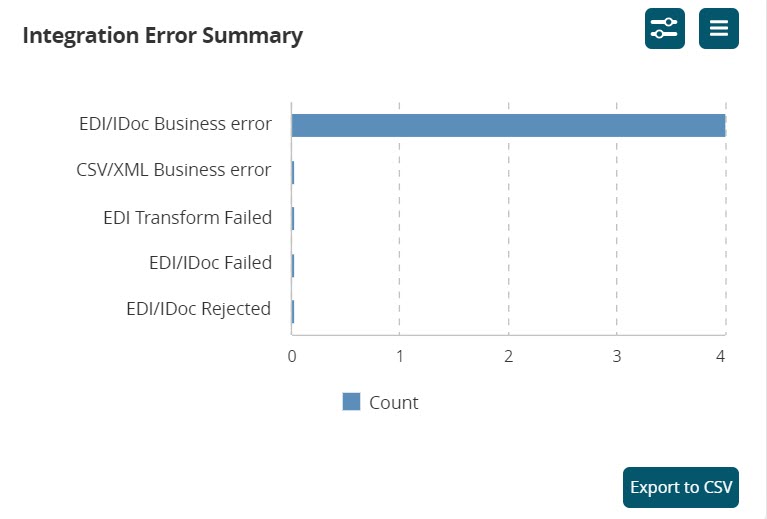
Hover your mouse over a count bar in the chart to view additional details.
Click the active links for the integration type along the x-axis or the actual count bars.
The report for that data point displays in a new tab. Please see the following table for an explanation of the error failure categories and their respective reports:Integration Type
Description and Report
EDI/IDOC Business error
The EDI Message Queue Report screen displays using a filter for the Business error state. Users can click various links to view other details, including popups under the Error Message column and the acknowledgment transaction (Ack Trans) column.
CSV/XML Business error
The Message Detail Errors report displays CSV/XML failure details in the Business error state. Clicking the active number links in the Error Count column displays the Message Detail Report with further error details.
EDI Transform Failed
The EDI Message Queue Report screen displays using a filter for the Transform failed state. Users can click various links to view other details, including popups under the Error Message column and the acknowledgment transaction (Ack Trans) column.
EDI/IDOC Failed
The EDI Message Queue Report screen displays using a filter for the Failed state. Users can click various links to view other details, including popups under the Error Message column and the acknowledgment transaction (Ack Trans) column.
EDI/IDOC Rejected
The EDI Message Queue Report screen displays using a filter for the Rejected state. Users can click various links to view other details, including popups under the Error Message column and the acknowledgment transaction (Ack Trans) column.
Click the Filter Options button in the top right corner of the widget to change the filtering options.
The settings popup window displays. For more information, please see the "Configuring Widgets" section of the Online Help for more information.Click the List View icon to toggle the widget's data to a list.
The widget's display changes to a table list, and the icon changes to Chart View.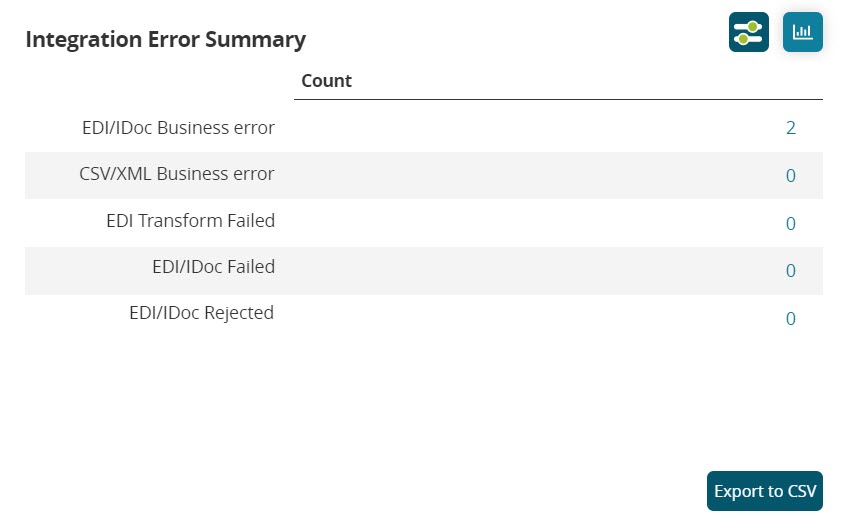
Click the active links for the category name in the row header or the actual count number link.
The report for that data point displays in a new tab as described in the table above.Click the Export to CSV button to export the report to a CSV file.